Is Stellar Lumen (XLM) Ready to Recover From Yesterday’s Crash?
Stellar Lumen (XLM) is in the red, much like most of the crypto market, dropping by almost 20% over the previous session; but it seems to be

| (%) | ||
|
MARKETS TREND
The market trend factors in multiple indicators, including Simple Moving Average, Exponential Moving Average, Pivot Point, Bollinger Bands, Relative Strength Index, and Stochastic. |
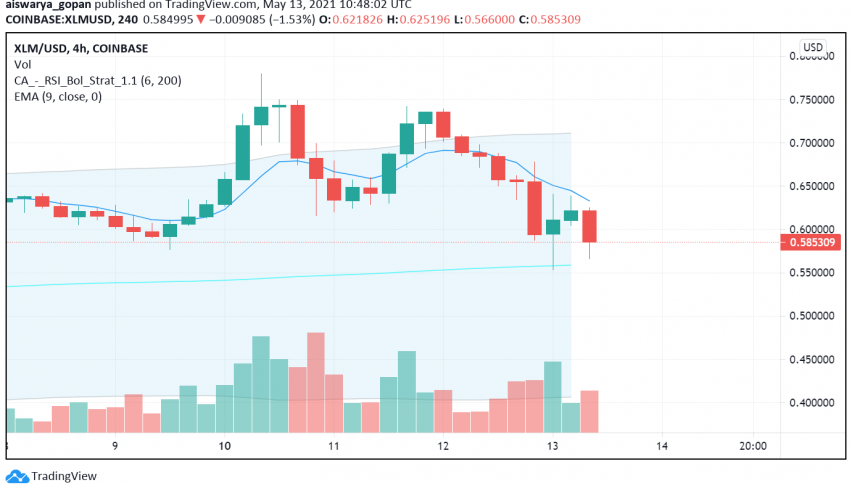
Stellar Lumen (XLM) is in the red, much like most of the crypto market, dropping by almost 20% over the previous session; but it seems to be seeing somewhat of a recovery in early trading today. The XLM token has experienced considerable volatility as Wednesday’s crash came a day after the digital asset saw a double-digit rally through Tuesday.
Much like the leading cryptocurrencies, Stellar Lumen experienced a severe crash following the release of the US consumer prices which revealed a stronger than expected jump. The high reading reignited fears of inflation spiking as the US makes its way out of the coronavirus-induced slump, sending investors away from riskier assets like equities and cryptos.
At the time of writing, XLM/USD is trading at around $0.58, after having traded bullish earlier in the day and rising to a high of $0.7340 before sliding down. For now, the price chart is exhibiting signs of choppy trading in XLM, indicating indecision among traders in the absence of supporting fundamentals.
Key Levels to Watch
Leading indicators MACD and momentum oscillator on the 4-hour chart are pointing to a bearish bias among XLM traders at present. In case the price action goes in line with these indicators, the support at $0.53 will be key to watch.
However, as long as the price remains above the $0.60 level, there is some hope for an uptrend to resume. In such an event, keep an eye for the immediate resistance at around $0.68 – a break above this can strengthen the positive sentiment and encourage traders to break past the key $0.70 level and attempt at taking XLM/USD higher in the near-term.
| (%) | ||
|
MARKETS TREND
The market trend factors in multiple indicators, including Simple Moving Average, Exponential Moving Average, Pivot Point, Bollinger Bands, Relative Strength Index, and Stochastic. |
- Check out our free forex signals
- Follow the top economic events on FX Leaders economic calendar
- Trade better, discover more Forex Trading Strategies
- Open a FREE Trading Account