Gold Price Forecast – Triple Top Breakout, Brace for Buying!
During Monday's Asian trading session, the precious metal gold succeeded in extending its previous three-day bullish rally and hit a three
Written by:
Arslan Butt
•
Monday, May 17, 2021
•
3 min read
•
Last updated: Monday, May 17, 2021

During Monday’s Asian trading session, the precious metal gold succeeded in extending its previous three-day bullish rally and hit the three-month high around above the mid-$1,800 level as investors digested depressing economic data from China and the U.S. It should be noted that the downbeat U.S. data tamed rising inflation fears and weighed heavily on the Treasury yields, which helped the non-yielding GOLD . Meanwhile, intensifying doubts over the Chinese economic recovery lend some additional support to the safe-haven gold prices. Apart from this, the prevalent bullish bias surrounding the bullion prices could also be mainly attributed to the escalating Israel-Palestine tussles, which are turning scary and contributes to the safe-haven gains. Besides this, the bearish bias surrounding the U.S. dollar, triggered by the dismal U.S. data, was seen as one of the key factors that lend some additional support to the dollar-denominated commodity.
Across the ocean, the fresh COVID-19 outbreaks in some Asian major countries re-triggered doubts about global economic recovery, which helped the gold prices stay bid. Conversely, the faster vaccinations in the West turned out to be one of the key factors that kept the lid on any additional gains in the safe-haven metal. In the meantime, the gains in the safe-haven metal were also capped by the reports suggesting that the U.S. and the European Union’s (E.U.) are up to support the coronavirus (COVID-19) vaccine patents. At the particular time, gold is trading at 1,853.24 and consolidating in the range between 1,842.08 and 1,853.28. Looking forward, the traders seem cautious to place any strong position ahead of the minutes from the U.S. Federal Reserve’s latest meeting, which is due on Wednesday.
The global market’s sentiment snapped its two-day uptrend performance. It turned sour on the day as the intensified coronavirus (COVID-19) fears, geopolitical tussles in the Middle East (Israel-Palestine), not to forget the downbeat US and China data which raised doubts over the global economic recovery. As per latest reports, the fresh coronavirus COVID-19 outbreaks in Singapore and Taiwan recorded 206 new cases, which in turn, caused both countries to tighten restrictive measures.Meanwhile, Singaporean primary, secondary, junior college, and Millennia Institute students moved to full home-based learning (online) from May 19 till the end of the school term on May 28. Across the pond, the United Nations (U.N.) refrained from any direct interference into the Gaza affair, even after the Israel-Palestine tussles intensify. China blames America for this, which weighs on the U.S. stocks. In simple words, the bearish appearance of the U.S. stock futures tends to highlight the risk-off sentiment, which tends to benefit the dollar-denominated commodity.
On the data front, the recently released Chinese data showed that the industrial production growth slowed down to 9.8% year-on-year in April. In the U.S., data said that retail sales failed to grow month-on-month in April as the impact from stimulus checks distributed earlier in the year faded.
Despite the risk-off market mood, the broad-based U.S. dollar failed to stop its early-day negative performance and dropped to a one-week low amid downbeat U.S. data, with the U.S. Federal Reserve sticking to its current dovish policy. Meanwhile, the benchmark U.S. 10-year Treasury yield dropped in the wake of dismal U.S. data, which put further pressure on the U.S. dollar. Therefore, the losses in the U.S. dollar were seen as one of the key factors that help the gold prices to stay bid as the price of gold is inversely related to the price of the U.S. dollar.
Market traders will keep their eyes on the multiple Fed policymaker’s speeches. Meanwhile, the ongoing battle in Gaza and China’s recently downbeat signals will also be closely observed. Last but not the least, the U.S. dollar price movement will continue to play a key role in the gold direction.

Gold – XAU/USD – Daily Support and Resistance
S3 1789.63
S2 1813.46
S1 1828.59
Pivot Point 1837.28
R1 1852.42
R2 1861.11
R3 1884.93
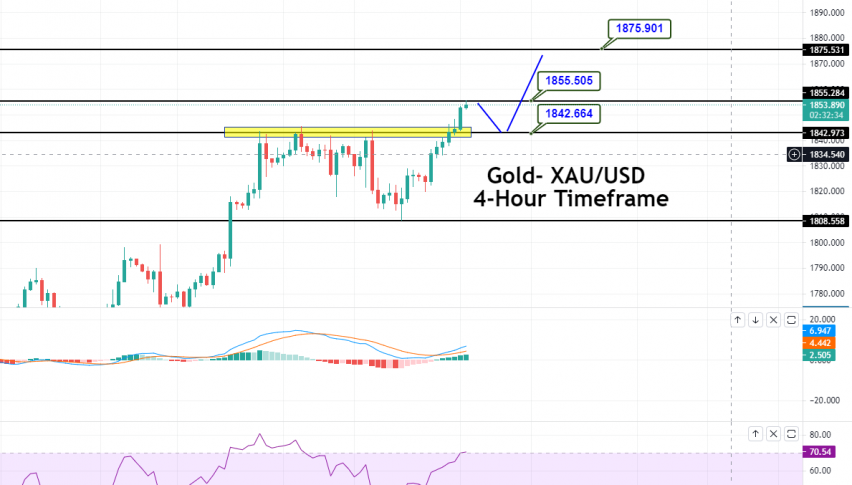
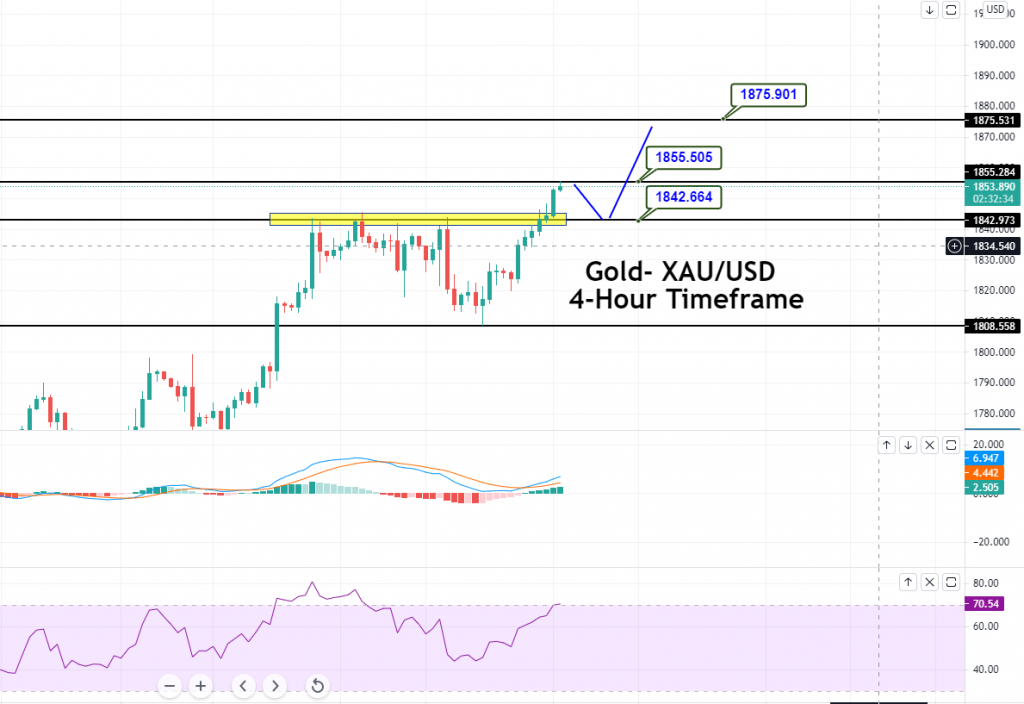
On the 4-hour timeframe, GOLD has closed bullish engulfing candle and has violated the triple top resistance at 1,842 level. On the higher side, gold is likely to continue trading bullish until the next resistance area of 1,855, and violation of this level can extend buying until 1,865. Below 1,855 level, gold can find support at 1,842 level. The RSI and MACD suggest strong buying; therefore, we have opened a buying trade. Good luck!
Arslan Butt
Lead Markets Analyst – Multi-Asset (FX, Commodities, Crypto)
Arslan Butt serves as the Lead Commodities and Indices Analyst, bringing a wealth of expertise to the field. With an MBA in Behavioral Finance and active progress towards a Ph.D., Arslan possesses a deep understanding of market dynamics.
His professional journey includes a significant role as a senior analyst at a leading brokerage firm, complementing his extensive experience as a market analyst and day trader. Adept in educating others, Arslan has a commendable track record as an instructor and public speaker.
His incisive analyses, particularly within the realms of cryptocurrency and forex markets, are showcased across esteemed financial publications such as ForexCrunch, InsideBitcoins, and EconomyWatch, solidifying his reputation in the financial community.