Ethereum Trade Idea – ETH/USD Violates Downward Trendline
ETH/USD closed at $2094.28 after placing a high of $2319.10 and a low of $2014.34. Ether dropped to its lowest level since April 8
Written by:
Arslan Butt
•
Monday, May 24, 2021
•
2 min read
•
Last updated: Monday, May 24, 2021

ETH/USD closed at $2094.28 after placing a high of $2319.10 and a low of $2014.34. Ether dropped to its lowest level since April 8 and continued its bearish streak for the third consecutive session on Sunday. The latest decline in Ethereum prices was driven by the statement issued by the Chinese State Council’s Financial Stability and Development Committee that it will crack down on Bitcoin mining and trading activities as a part of efforts to fend off financial risks.
This statement came in just days after three Chinese industry bodies tightened a ban on banks and payment companies to stop providing trading services for cryptocurrencies. The Chinese State Council issued a notice that demanded reduced power consumption in an industrial area where many bitcoin mining facilities operate. This was the first attempt by the Chinese council to take a step against bitcoin mining. BITCOIN fell by 35% within a week following this news, combined with the negative comments from Elon Musk. The declining bitcoin prices added to pressure on the whole cryptocurrency market and dragged other cryptocurrencies with it, including Ethereum.
Another factor that dragged Ethereum prices further on the downside could be the rising prices of the U.S. dollar. The greenback was stronger across the board on Friday as the DXY rose above 90 levels on the back of favorable PMI data from the U.S.
On the other hand, Ethereum was getting support from some favorable reports, including one from the U.K. Parliament. A member of the United Kingdom Parliament, Tom Tugendhat, urged the nation towards implementing more innovations in its financial sphere. He also outlined the growth of the cryptocurrency sector and hinted that he was more bullish on Ether rather than Bitcoin.

ETH/USD Daily Technical Levels
Support Resistance
2235.05 2410.03
2176.72 2526.68
2060.07 2585.01
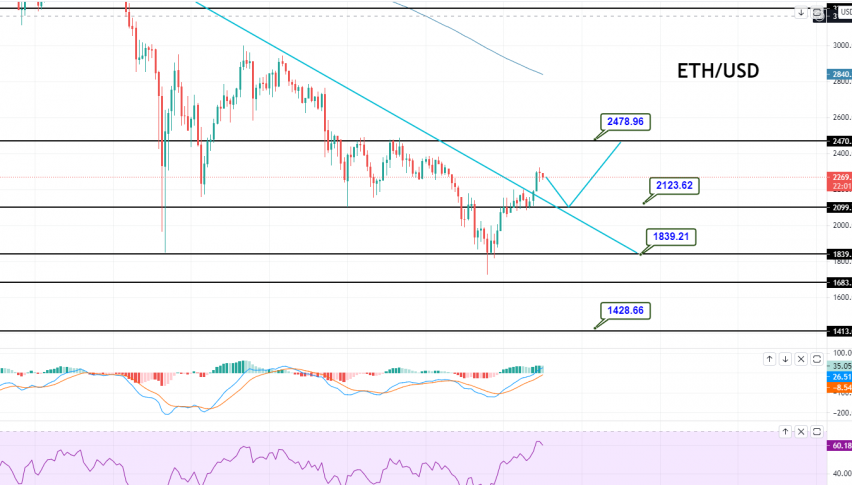
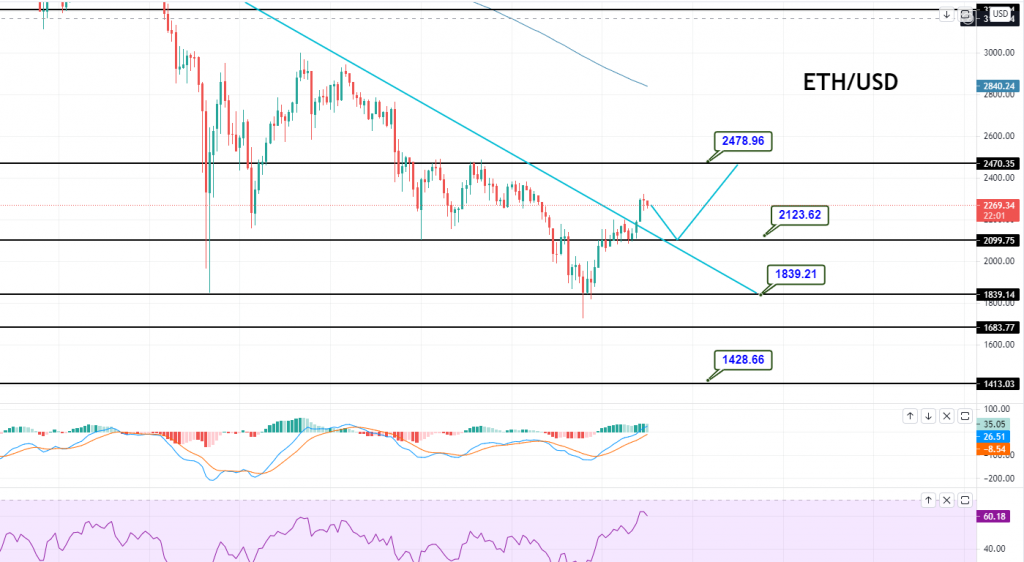
Pivot Point: 2351.70ETH/USD]is trading at 2,260 area, facing resistance at 2,478 level. On the 4-hour chart, the pair has violated the downward trendline that was extending a solid resistance around 2,206 level. For now, the same resistance level is working as a support. The RSI and MACD indicators support the bullish trend in Ethereum. The idea is to stay bearish below 0.3400 area today and bullish above the same. Good luck!
Arslan Butt
Lead Markets Analyst – Multi-Asset (FX, Commodities, Crypto)
Arslan Butt serves as the Lead Commodities and Indices Analyst, bringing a wealth of expertise to the field. With an MBA in Behavioral Finance and active progress towards a Ph.D., Arslan possesses a deep understanding of market dynamics.
His professional journey includes a significant role as a senior analyst at a leading brokerage firm, complementing his extensive experience as a market analyst and day trader. Adept in educating others, Arslan has a commendable track record as an instructor and public speaker.
His incisive analyses, particularly within the realms of cryptocurrency and forex markets, are showcased across esteemed financial publications such as ForexCrunch, InsideBitcoins, and EconomyWatch, solidifying his reputation in the financial community.
Related Articles