All US Fundamental Indicators Point to A FED Policy Reversal
The FED will soon have to accept the fact that the US economy is only getting stronger

The US economy was the first to start rebounding after the recession in spring last year due to coronavirus lockdowns. The global economy started rebounding as well in summer, but last winter we saw another period of weakness in the global economy as restrictions returned and in some places like Europe we saw another contraction.
Although, the US economy held up well and it has picked up further speed in 2021. All indicators are at all time highs or close by now, confirming the strong momentum in the US economy. The FED has been trying to play the data down, but it keeps getting better, so the FED will have to accept it soo, especially as the summer months are expected to be even stronger.
The USD is giving some signs of reversing higher, but the reversal will come once the FED rhetoric gives the first signs of change, which will be a good time to buy the USD. Below are some reports which show that, like the Q1 GDP report and the PCE inflation report.
US initial jobless claims in continuing claims.
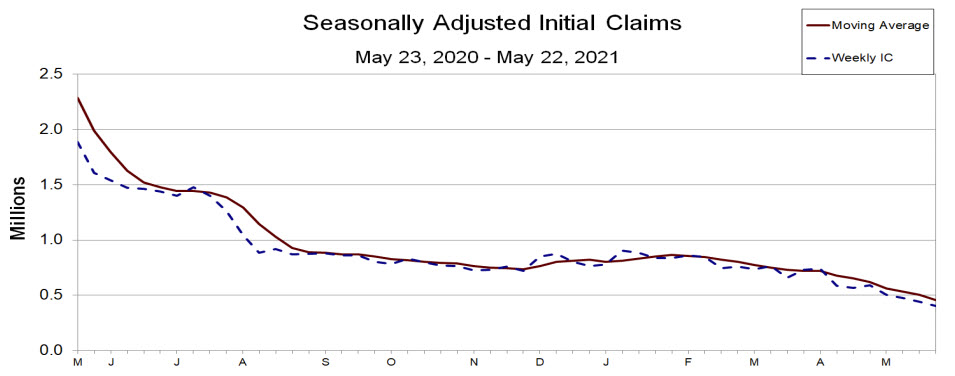
- US initial jobless claims 406K vs 425K estimate
- Prior report 444K unrevised. That was the lowest since March 14, 2020
- Initial jobless claims 406K versus 425K estimate. Down 38,000 and the week
- 4-week moving average of initial jobless claims 458.75K vs 504.75K.
- Continuing claims 3,642K vs 3,680K estimate.
- 4 week moving average of continuing claims 3,675K vs last week’s 3,677.75K.
- During the week ending May 8, 51 states reported 6,515,657 continued weekly claims for Pandemic Unemployment Assistance benefits and 51 states reported 5,191,642 continued claims for Pandemic Emergency Unemployment Compensation benefits. Last week 51 states reported 6,605,416 claims and 5,141,311 continued claims.
- The largest increases in initial claims for the week ending May 15 were in New Jersey (+4,812), Washington (+3,023), Minnesota (+1,806), West Virginia (+907), and Rhode Island (+792),
- The largest decreases were in Georgia (-7,392), Kentucky (-7,123), Texas (-3,881), Michigan (-3,560), and Florida (-2,994).
US Q1 GDP Second Estimate
First reading was +6.4%
Final Q4 reading was +4.3%
Personal consumption +11.3% vs +11.0% expected
GDP price index +4.3% vs +4.1% expected
Core PCE +2.5% vs +2.3% expected
Details:
Core sales excluding motor vehicles +6.5% vs +6.6% prelim
Final sales +9.4% vs +9.2% prelim
Inventories cut 2.78 pp from GDP
Net exports cut 1.2 pp from GDP
Govt spending adds 1.02 pp to GDP
Business investment +10.8% vs +9.9% prelim
Business investment in equipment +13.4% vs +16.7% prelim
Exports -2.9% vs -1.1% prelim
Imports +6.7% vs +5.7% prelim
Home investment +12.7% vs +10.8% prelim
With the drop in inventories and the poor performance of trade possibly reversing later in the year, there will be a consistent tailwind for GDP for a few quarters.
Highlights from the PCE Report for April 2021
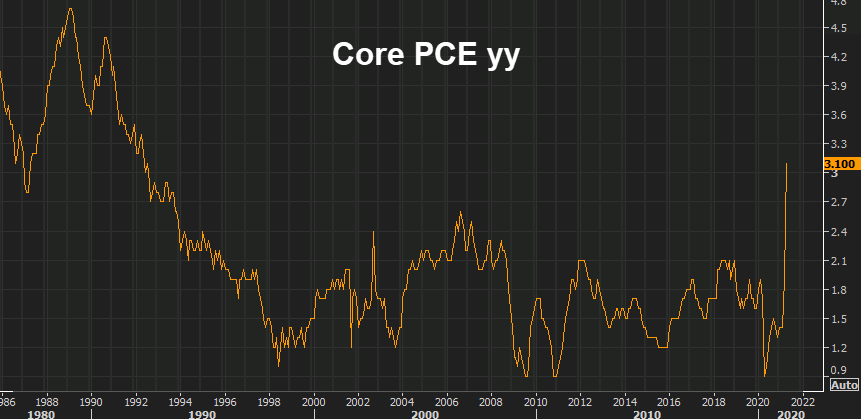
- Prior was +1.8%
- PCE core MoM +0.7% vs +0.6% expected
- Prior MoM +0.4%
- Deflator YoY +3.6% vs +3.5% expected
- Prior deflator YoY +2.4%
- Deflator MoM +0.6% vs +0.6% expected
- Prior MoM deflator +0.5% (revised to +0.6%)
- Full report
Consumers spending and income for April:
- Personal income -13.1% vs -14.2% expected. Prior month +20.9%
- Personal spending +0.5% vs +0.5% expected. Prior month +4.7%
- Real personal spending -0.1% vs +0.2% expected. Prior month +4.6%
- Goods +4.5%
- Durable goods +5.2%
- Services +3.1%
- Energy +24.8%
- Food +0.9%
- Check out our free forex signals
- Follow the top economic events on FX Leaders economic calendar
- Trade better, discover more Forex Trading Strategies
- Open a FREE Trading Account
- Read our latest reviews on: Avatrade, Exness, HFM and XM
Related Articles


Sidebar rates
Related Posts
