Ripple Price Forecast – XRP/USD Bullish Engulfing Pattern to Support Buying
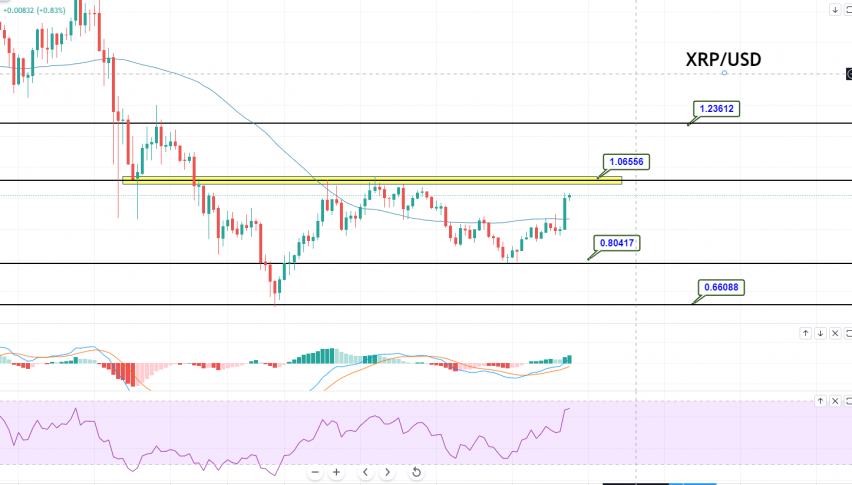
XRP/USD closed at $0.90614 after placing a high of $0.91389 and a low of $0.80641. After declining for the last three days, Ripple rose on
[[XRP/USD-sponsored]]
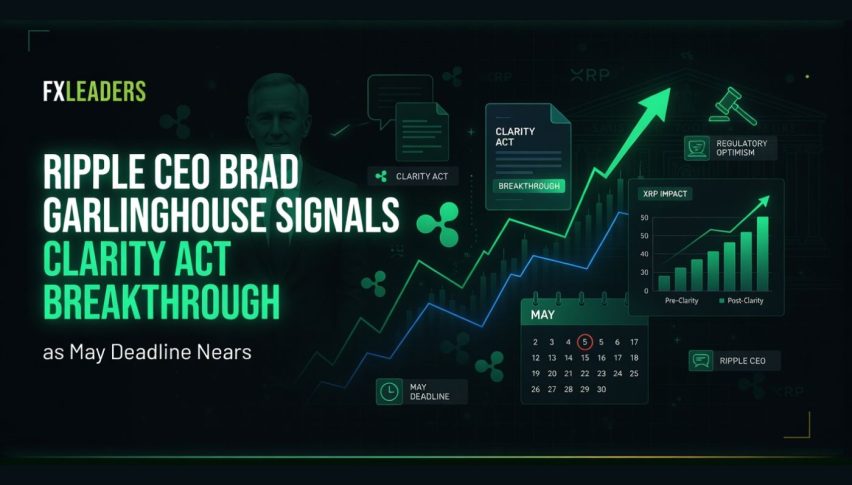
XRP/USD closed at $0.90614 after placing a high of $0.91389 and a low of $0.80641. After declining for the last three days, XRP/USD rose on Sunday and recovered most of its previous daily losses following the prevalent market trend. The Ripple CEO Brad Garlinghouse has revealed that Ripple’s fintech firm will go public after it settles the lawsuit that the U.S. Securities and Exchange Commission (SEC) filed against it, alleging the firm and two of its executives raised over $1.3 billion through an unregistered digital asset securities offering.
Garlinghouse revealed that the company had plans to go public in 2020, but the SEC’s lawsuit hindered this move then. He added that the company still plans on being listed on an exchange, and it hopes to do so after it resolves the lawsuit with the SEC. Furthermore, Ripple has reiterated its commitment to become carbon ‘net-zero’ by 2030 as part of an effort to avert worst-case climate change scenarios in a move similar to one made by most countries throughout the world. Ripple said that it was driving new research with leading universities to evaluate energy consumption across digital assets, credit card networks, and cash. This news added strength to XRP and moved its prices up on Sunday.
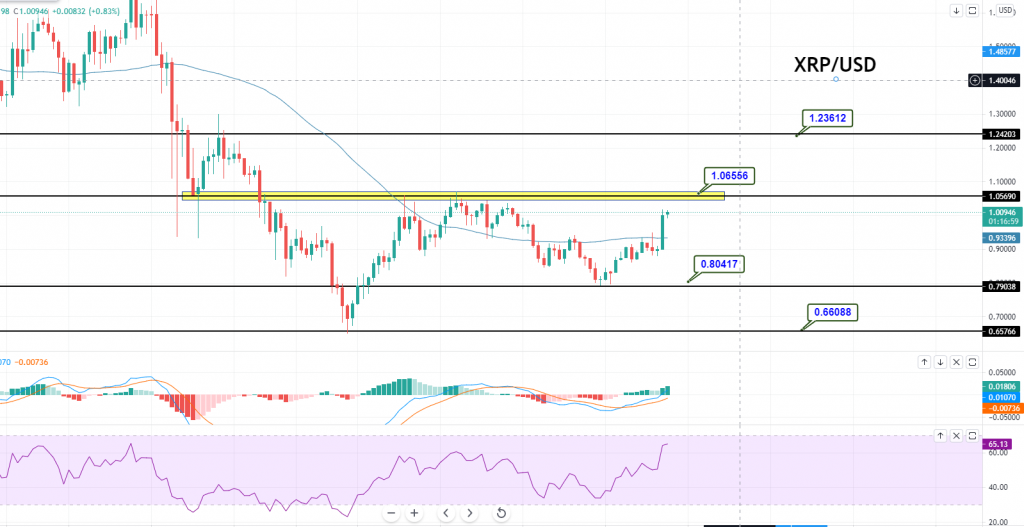
XRP/USD Daily Technical Levels
- Check out our free forex signals
- Follow the top economic events on FX Leaders economic calendar
- Trade better, discover more Forex Trading Strategies
- Open a FREE Trading Account
- Read our latest reviews on: Avatrade, Exness, HFM and XM
Related Articles
Sidebar rates
Related Posts
