ADA/USD Violates Symmetrical Triangle Pattern – Is it a Good Time to go Long?
The ADA/USD was closed at $1.575848 after placing a high of $1.593421 and a low of $1.508744. ADA/USD extended its bullish
Written by:
Arslan Butt
•
Tuesday, June 15, 2021
•
2 min read
•
Last updated: Tuesday, June 15, 2021

The Cardano closed at $1.575848, after achieving a high of $1.593421, and a low of $1.508744. The ADA/USD extended its bullish streak for the third consecutive session, reaching almost $1.600. According to a senior writer and anchor at Yahoo Finance, Zack Guzman, the famous ex-hedge fund manager, and major cryptocurrency investor, Mike Novogratz has called Cardano a “weird cult”. According to Guzman, Novogratz was shocked by the valuation of Cardano and said that things like Cardano do not die easily.
According to Novogratz, Bitcoin provided us with the idea that tokens can be created and used as an object to connect a community. He added that the code was not valuable anymore, but the social construct and brand were. He also compared ADA to DOGE and said that people might be able to debate the value of Dogecoin, but they cannot argue against its satire.
The comments by billionaire Novogratz got the attention of Cardano co-founder Charles Hoskinson, who also noted that fair, transparent, community-led cryptocurrencies were somehow cult. He added that, in simple words, the billionaire Novogratz wanted to state that there was no backdoor for getting in at a favorable price or for manipulating the market like the rest of the VC coins are doing. ADA found support after these comments and placed minor gains for the day.Meanwhile, the US dollar remained consolidated within a tight range, with zero movement throughout the day, because the investors were awaiting the monetary policy decision from the Fed, which is due on Wednesday, and were cautious about placing any strong bid ahead of it. This kept the greenback flat during the trading session and limited the upward momentum in the ADA/USD on Monday.
Furthermore, there was no macroeconomic data from the US on Monday, and this put further pressure on the greenback. As a result, the US Treasury Yield on the benchmark 10-year note rose to 1.50%, but this failed to provide the US dollar with any significant support.

ADA/USD Daily Technical Levels
Support Resistance
1.525253 1.609930
1.474660 1.644014
1.440576 1.694607
Pivot Point: 1.559337
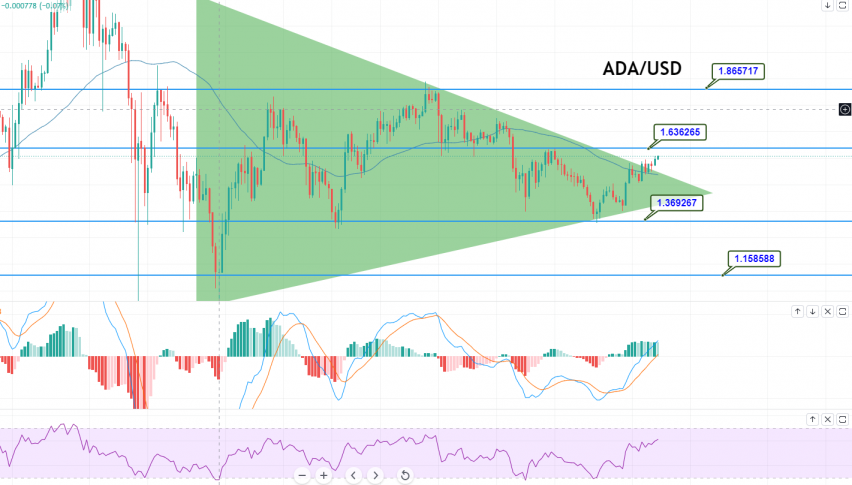
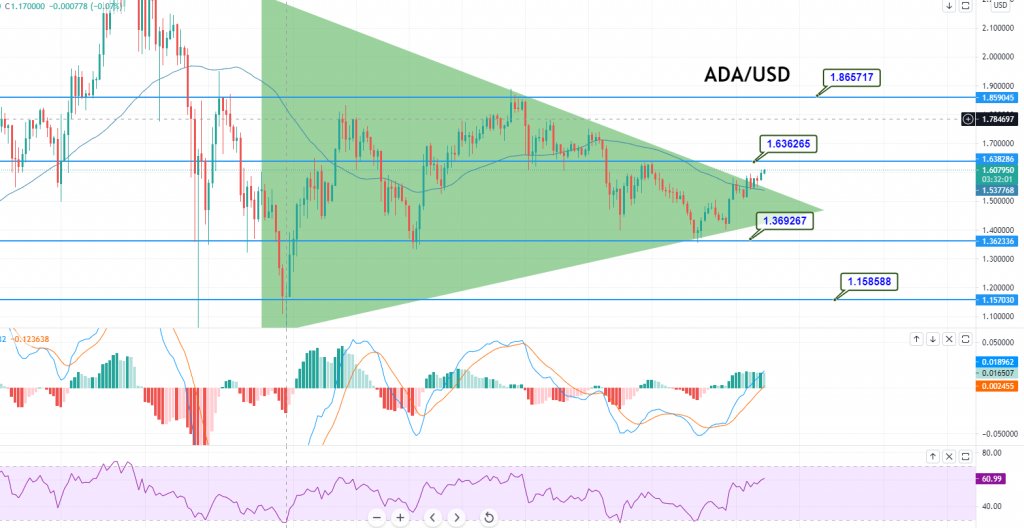
The ADA is trading with a bullish bias at 1.6052, after having violated the symmetrical
triangle pattern on the four-hourly timeframe. On the lower side, the ADA/USD pair is likely to find support at the 1.5009 level, with a resistance level of 1.6362. A bullish breakout at 1.6362 could trigger a buying trend until 1.7550 and 1.8657. At the same time, a bearish breakout at the 1.3692 level could extend the selling trend to the 1.1585 level. The MACD and
RSI suggest a buying trend; therefore, let’s consider taking a buying trade over the 1.5128 level today. Good luck!
Arslan Butt
Lead Markets Analyst – Multi-Asset (FX, Commodities, Crypto)
Arslan Butt serves as the Lead Commodities and Indices Analyst, bringing a wealth of expertise to the field. With an MBA in Behavioral Finance and active progress towards a Ph.D., Arslan possesses a deep understanding of market dynamics.
His professional journey includes a significant role as a senior analyst at a leading brokerage firm, complementing his extensive experience as a market analyst and day trader. Adept in educating others, Arslan has a commendable track record as an instructor and public speaker.
His incisive analyses, particularly within the realms of cryptocurrency and forex markets, are showcased across esteemed financial publications such as ForexCrunch, InsideBitcoins, and EconomyWatch, solidifying his reputation in the financial community.