Ripple Facing the Last Support Indicator, as it Heads For May’s Lows
Ripple facing the last indicators as it falls on the way down
It looked like cryptocurrencies were starting to bounce higher after the crash in May, but all attempts to reverse the course higher ended up being a dead cat bounce. Then they traded sideways for about a month, suggesting that they were going to stabilize at last.
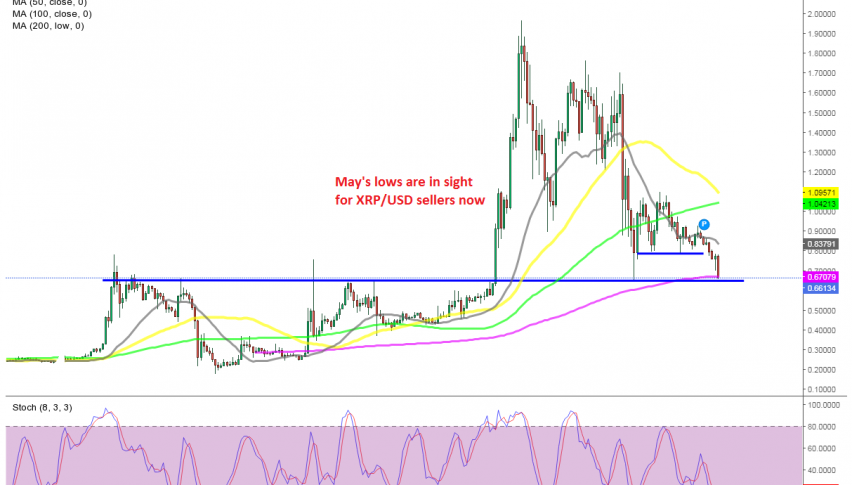
But, now we are seeing some increased bearish momentum again in the cryptomarket. Ripple coin (XRP) fell to $0.64-65 during the crash last month, where it formed a bottom and bounced from there to above $1.
But the 20 SMA (gray) has turned into resistance on the daily chart and this has been pushing the price in XRP/USD down on this timeframe. Yesterday we saw Ripple form a hammer candlestick, which is a bullish reversing signal, but there has been no bullish bounce.
Instead, the selloff is continuing today, and now Ripple coin is facing the lows we saw in May, as the 200 SMA (purple) tries to act as support at the bottom. Although, as we explained in our Ripple 2021 forecast, the decline seems broad-based across the crypto market, and the 200 SMA is giving up, so it seems like the bearish momentum will continue in the crypto market.
- Check out our free forex signals
- Follow the top economic events on FX Leaders economic calendar
- Trade better, discover more Forex Trading Strategies
- Open a FREE Trading Account
- Read our latest reviews on: Avatrade, Exness, HFM and XM
Related Articles

Sidebar rates
Related Posts
