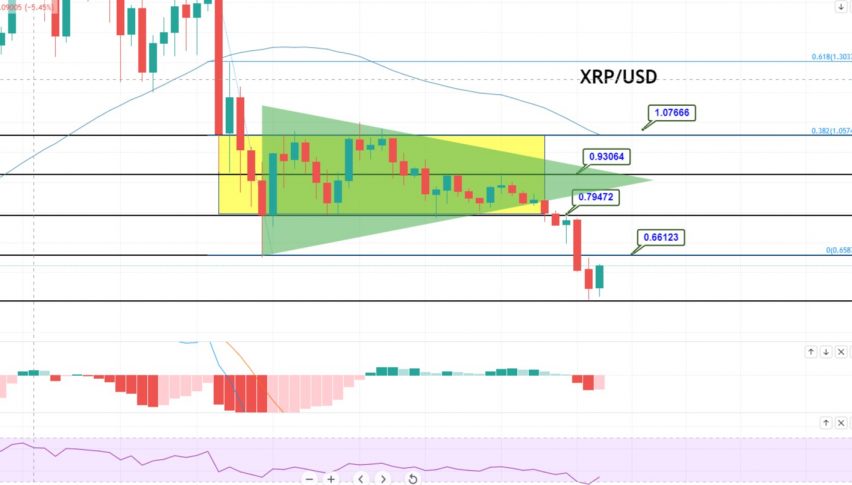
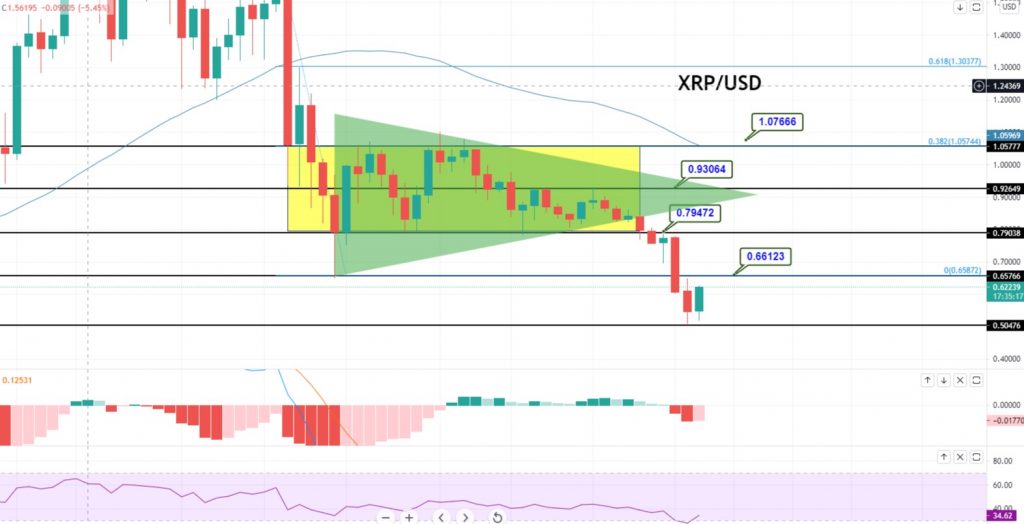
XRP/USD Taking a Bullish Correction – All Eyes on 0.6615 Resistance!
The XRP/USD pair is trading with a strong bearish bias at 0.6242 level. Right now, it's taking a bullish reversal towards the next...
The XRP/USD ended the day at $0.60700, after placing a high of $0.77554, and a low of $0.60700. The XRP/USD reached its lowest level since April 4 on Monday, amid the recent market crash, which was driven by the cryptocurrency crackdown by the Chinese authorities. The recent market crash was caused by the latest move in China, to extend its strike on cryptocurrency. The government called a meeting for representatives from the Industrial, Commercial and Agricultural Banks of China and the payment service provider, Alipay, to remind them of the ban on cryptocurrencies. Furthermore, the financial institutions were told that the provision of any service to their clients, related to cryptocurrency, would be considered illegal.
Following this order, the Agricultural Bank of China also suspended all of its crypto-related services. If any customer engages in business related to cryptocurrencies, the bank will close his account. Furthermore, the authorities in China’s southwestern province also ordered an end to crypto mining, resulting in many bitcoin mines in the Sichuan region being shut down. This news put further pressure on the crypto market, and the XRP/USD also followed the bearish trend.
On the other hand, Jeremy Hogan, a partner at the law firm Hogan & Hogan, said that the lawsuit brought by the US Securities and Exchange Commission against Ripple Labs, over the sale of XRP tokens, could extend into 2022. These comments also weighed on the XRP/USD, dragging its prices downward. Meanwhile, the rally in the US dollar took a break, which saw it dropping on Tuesday. This ultimately capped further losses in the XRP/USD. The US Dollar Index, which measures the value of the greenback against six major currencies, fell to the 91 level, and limited the downward pressure on the XRP/USD, as the two currencies have a negative correlation.

XRP/USD Daily Technical Levels
Support Resistance
0.72925 0.79743
0.68497 0.82133
0.66107 0.86561
Pivot Point: 0.75315
The XRP/USD pair is trading at 0.6242, with a strong bearish bias. Right now, it’s taking a bullish reversal towards the next resistance area of 0.6612. Further to the upside, it may face resistance at 0.7903. Furthermore, the MACD and RSI are coming out of the oversold zone, therefore there are odds of a bullish reversal in the XRP/USD pair. The Ripple could remain bullish today, until the 0.7531 level, as this may extend a solid resistance for the crypto. Good luck!
- Check out our free forex signals
- Follow the top economic events on FX Leaders economic calendar
- Trade better, discover more Forex Trading Strategies
- Open a FREE Trading Account