Bullish Price Action in EUR/USD After Softer US Data
EUR/USD is finding support at the 20 SMA, as fundamentals improve for buyers

The EUR/USD turned bearish last week, after the FED changed its rhetoric and mentioned rate cuts and tapering of bond purchases. The price tumbled around 400 pips down, as the momentum in the USD turned bullish. But the decline stopped, and the price started reversing higher this week.
The 20 SMA (gray) turned into resistance for some time, but it was eventually broken, and now it seems like this moving average has turned into support. So, the price action looks bullish for this pair, after the rapid change of tone from the FED yesterday, coming from Jerome Powell’s mouth.

The 20 SMA has turned into support for the EUR/USD
EUR/USD Live Chart
Today, the economic data from the US was a bit soft, which is helping the case for the EUR/USD buyers, although the 50 SMA (yellow) stands above this level, which should provide some resistance. Below are the US GDP and unemployment claims reports:
US Q1 2021 GDP
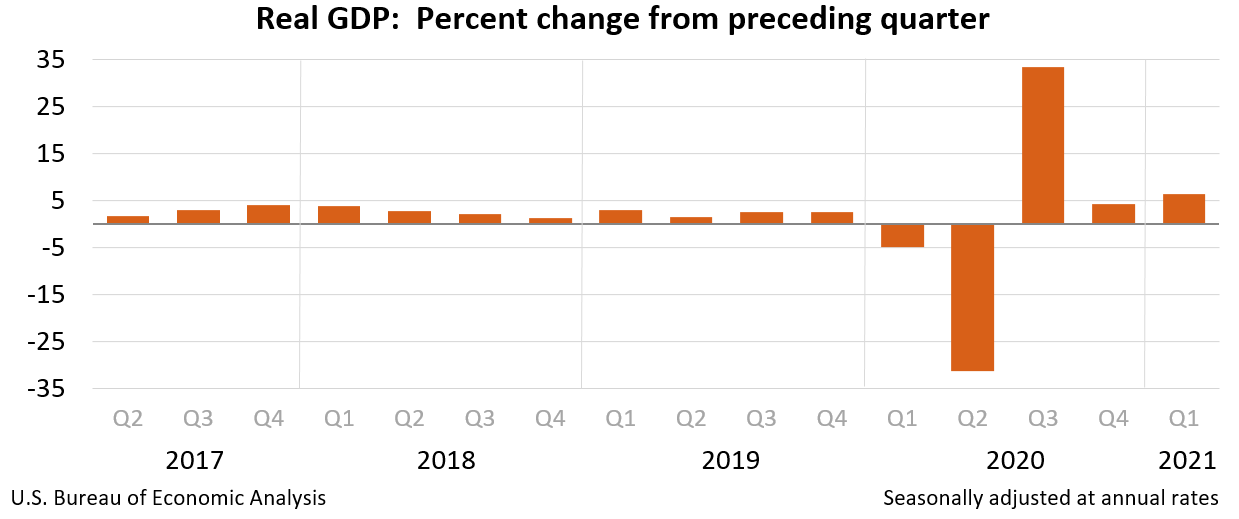
- Q1 GDP (third reading) +6.4% vs +6.4% expected
- First reading and second reading were +6.4%
- Final Q4 2020 reading was +4.3%
- Personal consumption +11.4% vs +11.4% expected
- GDP price index +4.3% vs +4.3% expected
- Core PCE +2.5% vs +2.5% expected
Details:
- Ex motor vehicles +6.5% vs +6.5% second reading
- Corporate profits after tax +1.7% vs -0.8% in second reading
- Final sales +9.2% vs +9.4% second reading
- Inventories cut 2.67 pp from GDP vs -2.78 pp from GDP in second reading
- Net exports cut 1.5 pp of GDP vs +1.2 pp from GDP in second reading
- Govt spending adds 1.02 pp to GDP vs +1.02 pp to GDP in second reading
- Business investment +11.7% vs +10.8% second reading
- Business investment in equipment +15.0% vs +13.4% second reading
- Exports -2.1% vs -2.9% second reading
- Imports +9.5% vs +6.7% second reading
- Home investment +13.1% vs +12.7% second reading
The third reading is rarely a market mover. We will get the first look at the Q2 GDP at the end of July. The largest boost to the GDP in industry terms was from durable goods manufacturing, while the largest drag was non-durable goods manufacturing. Overall, 17 of 22 industry groups contributed positive growth.
US Jobless Claims
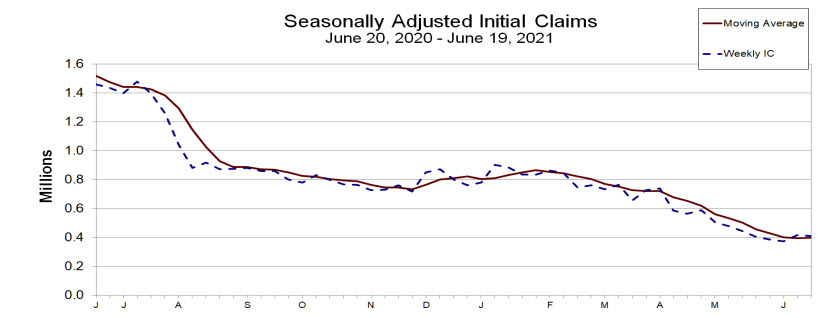
- Initial jobless claims 411K versus 380K estimate. Prior week revised to 418K from 412K previously reported
- 4-week moving average of initial jobless claims 397.75K versus 396.25K last week
- Continuing claims 3390K vs 3460K estimate. This is the lowest level since March 21, 2021 – it was 3094K. The prior week was revised higher, to 3534K from the 3518K previously reported
- 4-week moving average continues to climb – 3552.5K vs last week’s 3607.75K
- The largest increases in initial claims for the week ending June 12 were in Pennsylvania (+21,905), California (+15,131), Kentucky (+9,172), Florida (+3,344) and Texas (+3,127),
- The largest decreases were in Michigan (-5,615), Delaware (-2,516), Washington (-1,998), Tennessee (-1,746) and Alabama (-1,706).
US Durable Goods Orders Report
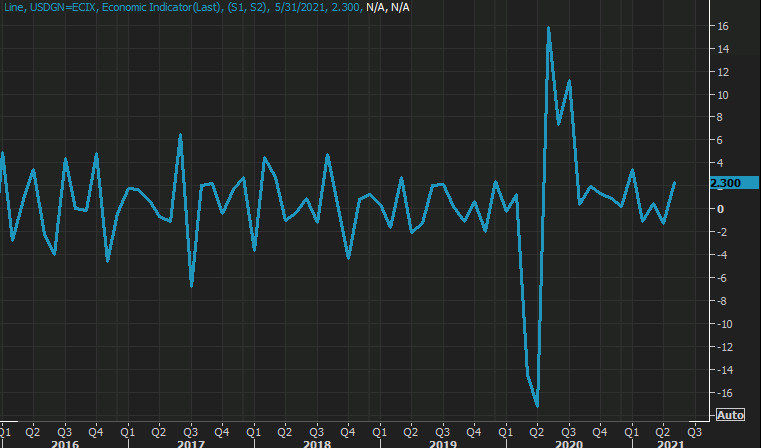
- May prelim durable goods orders +2.3% vs +2.8% expected
- Prior was -1.3% (revised to -0.8%)
- Durables ex transportation +0.3% vs +0.7% expected
- Prior ex transportation +1.0% (revised to +1.7%)
- Capital goods orders non-defense ex-air -0.1% vs +0.6% expected
- Prior capital goods orders non-defense ex-air +2.2% (revised to +2.7%)
- Capital goods shipments non-defense ex-air +0.9% vs 0.8% expected
- Prior capital goods shipments non-defense ex-air +0.9% (revised to +1.0%)
Perhaps the poor numbers shouldn’t be such a surprise, given some of the bottlenecks in the supply chain. Factory PMIs have been extremely strong. Also note the upward revision in the prior core orders.
- Check out our free forex signals
- Follow the top economic events on FX Leaders economic calendar
- Trade better, discover more Forex Trading Strategies
- Open a FREE Trading Account