The Bullish Sign Will Come for Litecoin, If It Closes the Week Above $145
Litecoin is pulling back up after finding support at the 100 SMA on the weekly chart
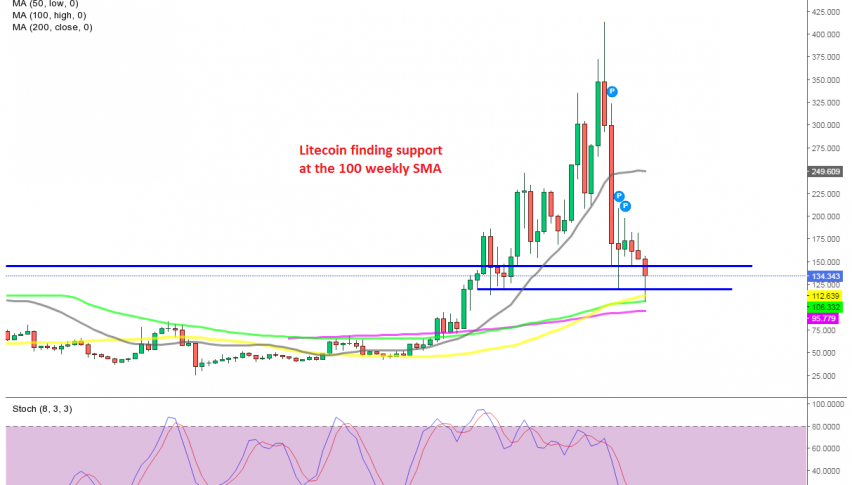
Litecoin was one of the major currencies which didn’t make new highs during the enormous bullish momentum which lasted for several months until the middle of March. It did make some major gains, as it surged from $50 in October last year, to $114, but it still was lower than the high in December 2017 at $420.
The 20 SMA (gray) did a great job as support, holding LTC/USD after pullbacks during the bullish momentum. But this moving average was broken during the crash in May, although other MAs might be working as support now.
The price traded sideways for about a month, while resuming the decline this week. The price broke below May’s low at $120, which was a support area from back in January as well. But it seems like LITECOIN has found support at the 100 SMA (green).
This moving average used to provide resistance during most of last year when Litecoin was trading mostly sideways, so now it is turning into support for this crypto. The 50 SMA (yellow) is also adding strength to that resistance.
But, this week’s candlestick will have to close above $145, which was a support area for a month. If that happens, then this week’s decline doesn’t count as a break, just a piercing, which flushed out the weak stops. So, we will have to wait until the end of the week for the signal.
- Check out our free forex signals
- Follow the top economic events on FX Leaders economic calendar
- Trade better, discover more Forex Trading Strategies
- Open a FREE Trading Account