Moving Averages Keeping EUR/GBP Buyers in Check
EUR/GBP continues to slide down, as MAs keep pushing it down
EUR/GBP has been declining since November last year, but the real bearish trend started in early January, after the EU and the UK reached the long-awaited trade deal. That validated the Brexit deal reached two years ago, which would have been useless without the trade deal.
This forex pair lost around 7 and a half cents from the top during Q1, as the EUR/GBP rallied around 10 cents higher, while the EUR/USD turned down in Q1, as the USD started gaining some ground after declining since March last year. In early April, we saw a jump, as the Euro increased again, although it wasn’t long before the EUR/GBP started sliding lower again.
EUR/GBP Live Chart
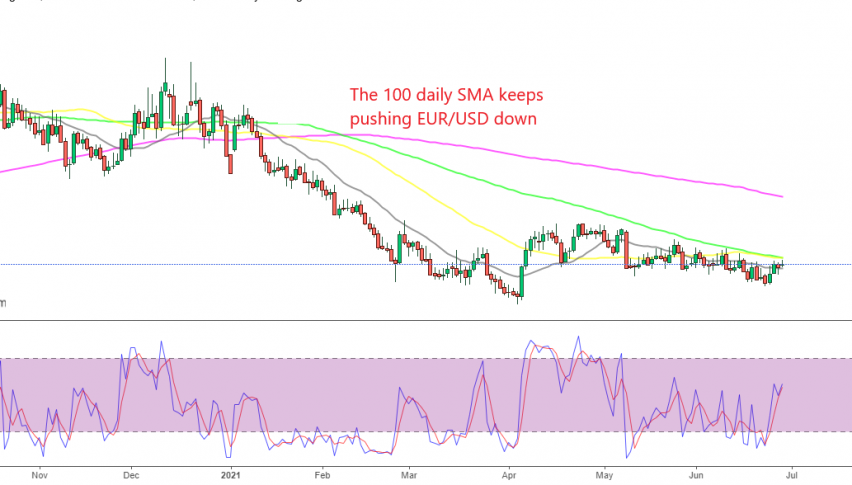
It hasn’t exactly resumed the bearish trend yet, since it will have to break below the March lows for the bearish trend to officially resume. But moving averages are doing a great job in providing resistance at the top and pushing this pair further down.
The 100 SMA (green) in particular, but also the 50 SMA (yellow), which has now moved above the price, have been doing a great job as resistance at the top on the EUR/GBP daily chart. Now the price has retraced higher, getting close to these 2 MAs, so this looks like a good opportunity to go short on the EUR/GBP, which we already did last week.

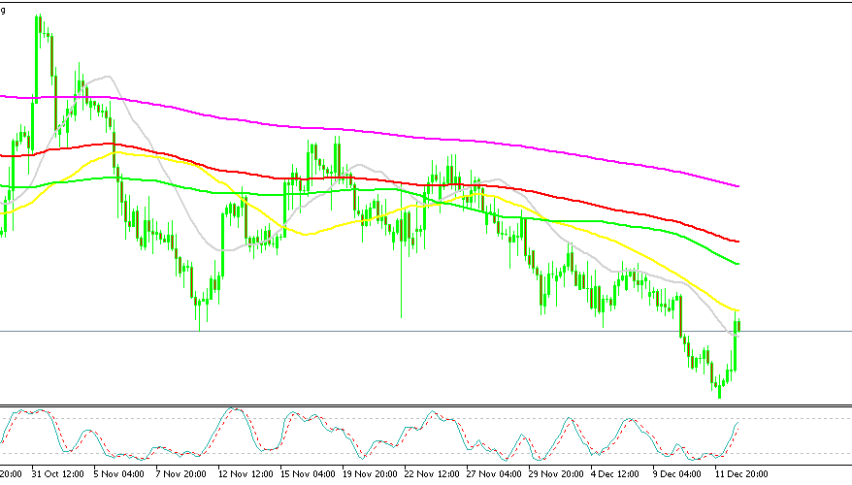
The 200 SMA is acting as support for the EUR/GBP on the H4 chart
On the H4 chart, the 200 SMA (purple), has been the ultimate indicator for this pair. It was acting as resistance in March, then it turned into support in April, after the jump higher that month. In May, the 200 SMA turned into resistance again and it has been acting as such for two months now, despite being pierced continually. The price rose above this moving average today, but couldn’t hold on up there, and has returned below the 200 SMA again.
So, this looks like a repeat of the previous patter at this MA. The H4 chart is also pointing towards a bearish reversal, so we got two strong indicators here, pointing downwards. We are already short with a short-term sell signal, as we mentioned above, but we might open a long-term sell signal as well, so follow our forex signals page, which includes all the important markets.
- Check out our free forex signals
- Follow the top economic events on FX Leaders economic calendar
- Trade better, discover more Forex Trading Strategies
- Open a FREE Trading Account
- Read our latest reviews on: Avatrade, Exness, HFM and XM
Related Articles

Sidebar rates
Related Posts
