DOGE/USD Sideways Trading Continues – Quick Trade Ideas!
Dogecoin price consolidated in a narrow range as investors started moving towards newer meme coins. The other similar

The Dogecoin price consolidated within a narrow range, as investors started moving towards newer meme coins. The other similar cryptocurrencies also experienced the range-bound move, as the hype around them began to fade away. Dogecoin and Elon Musk have been linked together due to his support for the meme-coin. Musk named himself the “Dogefather,” talked about it on SNL, and revealed plans to send Dogecoin to the moon. Many fans and followers of Dogecoin have favored these endorsements by Musk.
However, the recent turn of events might have disappointed the supporters, as the billionaire’s allegiance seems to have shifted to a newer and younger version of Dogecoin, known as Baby DogeCoin, which is not affiliated with the original coin. Over the past month, the price of Baby DogeCoin has surged by 4,376%, and it has a current market capitalization of $324 million.
DOGE/USD – Daily Technical Levels
0.245310 0.248940
0.244100 0.251360
0.241680 0.252570
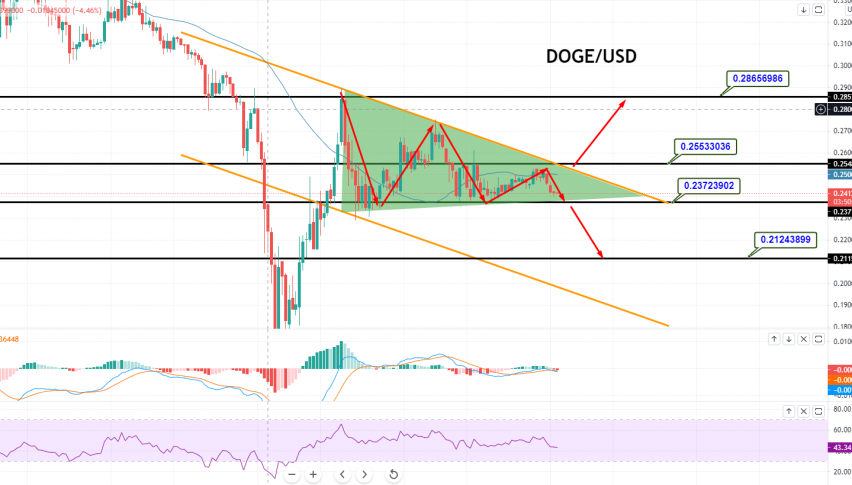
Pivot Point: 0.247730On the technical front, the DOGE/USD pair is supported at the 0.2353 level, and a breakout at 0.2353 could extend the selling trend until 0.2114. On the 4-hour timeframe, the violation of the 0.2114 level could extend the selling bias until the next support area of 0.1865. Conversely, the resistance remains at 0.2553, and a bullish breakout of this resistance could drive more buying trends until the 0.2750 level. The MACD and RSI values are tossing above and below their crossover levels; therefore, it’s hard to predict the trend until the breakout occurs. Placing a sell stop below the 0.2370 level could be an excellent idea today. Good luck!
- Check out our free forex signals
- Follow the top economic events on FX Leaders economic calendar
- Trade better, discover more Forex Trading Strategies
- Open a FREE Trading Account


