Bitcoin Continues the Range, Litecoin Continues to Decline
Litecoin is looking increasingly more bearish than Bitcoin
The larger picture seems similar for Bitcoin and Litecoin, apart from the fact that the BTC/USD had stopped making new highs by April, while the LTC/USD kept the bullish trend going until the middle of May. However, the crash was larger for Litecoin, as it lost exactly 70% of its value, while Bitcoin only lost a bit more than 50%.
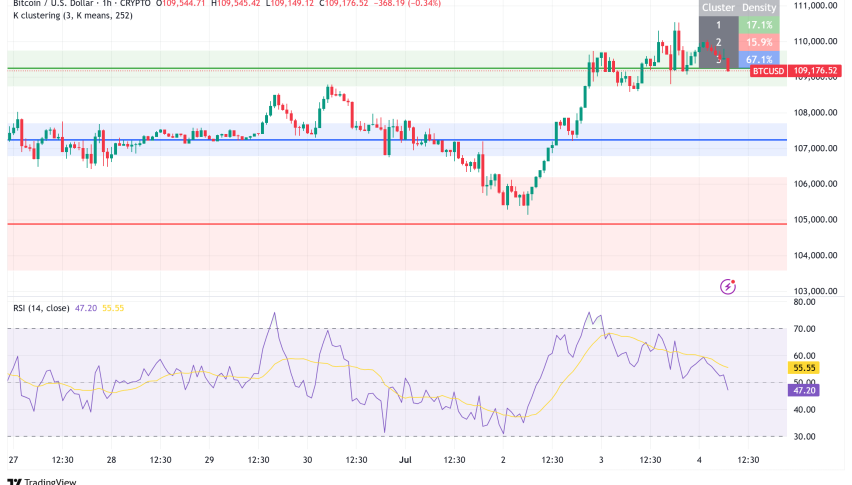
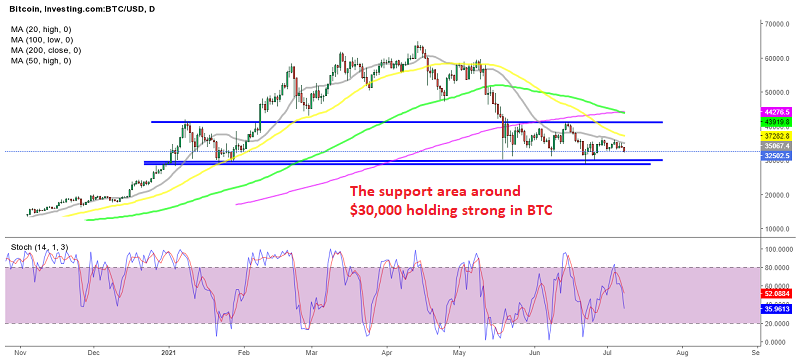
The situation since the crash seems worse for Litecoin as well, with a clear downward trend in the price, while Bitcoin has mostly been trading sideways for about two months. BITCOIN has formed a bottom at around $30,000 which is a solid support zone, despite having been pierced once.
At the top, the 20 SMA (gray) has been acting as resistance. For Bitcoin, the top of the range was above $40,000 until June, but last month, the 20 SMA (gray) has been pushing the highs lower for BTC/USD after it caught up with the price. This is not a good sign, since the smallest moving average has already turned into resistance. But, at least the support zone is remaining horizontal.
The daily chart for LITECOIN looks more bearish than for Bitcoin. Sellers broke below the May low of $120, dropping to $105, while the highs are getting lower at a faster pace than is the case with Bitcoin. This week, Litecoin failed to resume its bullish trend, and it is now reversing down after finding resistance at the 20 daily SMA.

The range is getting narrower for Litecoin
The range is getting tighter by the day, as the 20 SMA keeps pushing the highs lower, so the chances are that the break to the downside will happen soon. Now the stochastic indicator is heading down, so let’s see when the break comes in LTC/USD. I am a crypto bull normally, but the decline doesn’t seem to have ended, particularly for Litecoin, so I am standing on the sidelines for now, until the trend starts to change.
[[LTC/US-graph]]
- Check out our free forex signals
- Follow the top economic events on FX Leaders economic calendar
- Trade better, discover more Forex Trading Strategies
- Open a FREE Trading Account