AAVE Failing to Resume the Larger Uptrend, But the Bias Remains Bullish
AAVE/USD is trying to turn bullish, but MAs are acting as resistance, keeping buyers in check for now
Cryptocurrencies have given back large parts of their value, with AAVE/USD taking one of the biggest hits during the crash, losing nearly $500 or three-quarters of its value. Although, it still seems better supported than most other cryptos right now. Aave doubled in price after the bounce in July, increasing from around $170 until $340s.
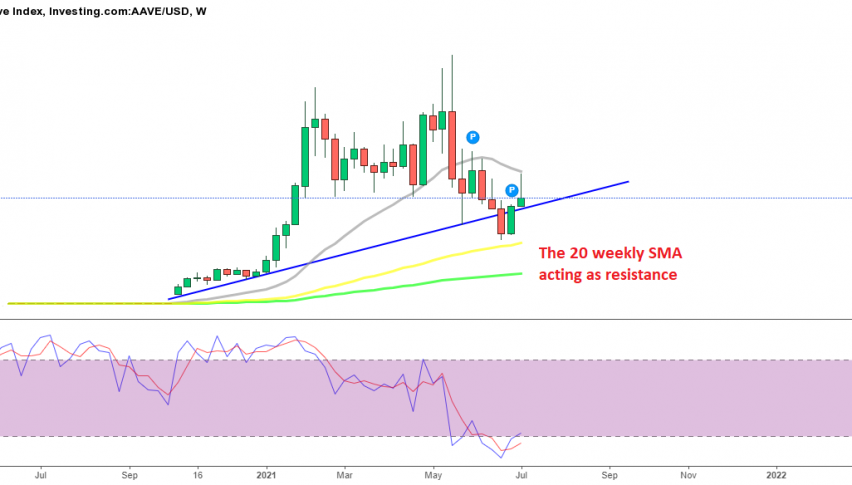
It slashed its losses in half, but the climb has stopped for now. Although, the bias still remains bullish for this pair, since the larger trend is still up, making higher lows after the pullback. On the weekly chart, the 20 SMA (gray) was providing support in April/May when cryptocurrencies were still climbing higher, but it got broken towards the end of May and it seems like this moving average has turned into resistance now.
The 20 SMA turned into resistance immediately after the price fell below it in late May, and it rejected the AAVE/USD again this week, with the price pulling back down after the bullish price action of the last two weeks. The ascending trendline has been broken, as we highlighted on our 2021 Aave forecast, so the 20 SMA remains the ultimate test on the weekly chart. If buyers manage to push above this moving average on the weekly chart, then the bullish trend will be back on, and until then, the uncertainty will continue, as the price is bouncing between the 50 SMA (yellow) and the 20 SMA.

Aave is forming a bearish reversing pattern on the daily chart
On the daily chart, moving averages have been acting as support during the bullish momentum, since Q4 of last year. But they got broken during the decline in May and June, and have turned into resistance now. The 20 SMA (gray) turned into resistance for Aave for about a month, but that moving average was broken earlier this week, as buyers tried to turn this crypto bullish.
However, the 100 SMA (green) and the 200 SMA (purple) turned into resistance, and after a couple of pin candlesticks, which are bearish reversing signals, AAVE/USD turned downwards today. But, the decline seems to have stalled, stopping right at the 50 daily SMA (yellow), while the 20 SMA is waiting lower down, so the bullish momentum is not over yet.
- Check out our free forex signals
- Follow the top economic events on FX Leaders economic calendar
- Trade better, discover more Forex Trading Strategies
- Open a FREE Trading Account