Has NEO bottomed?
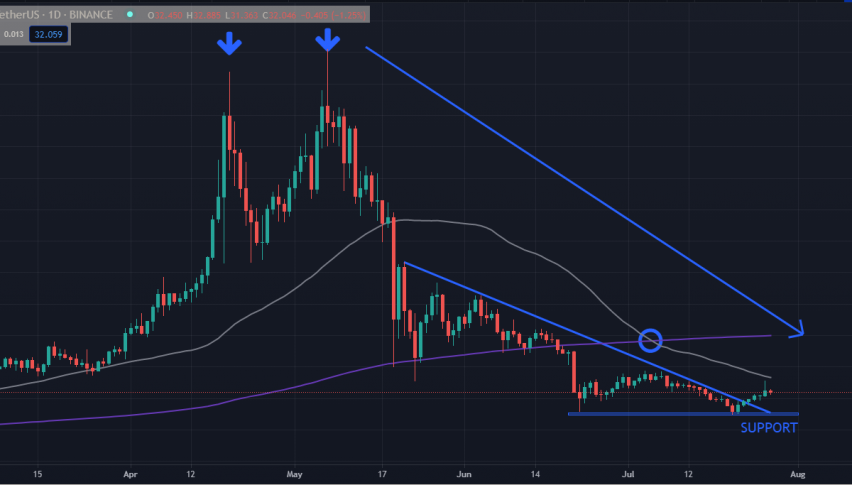
*NEO daily timeframe: It may have bottomed at the 25.00 support
NEO has been on a downtrend since it formed a bearish double-top pattern at the 140 levels in May 2021. It then fell below the 200-day moving average in mid-June and reached a low of 25 in the same month, also forming a death cross.
However, it would seem that NEO has bottomed since then, as it formed a relatively strong support at 25. Just last week, it bounced over this support and rallied above a short-term downtrend line. It rallied last week, with a higher trading volume than usual as well. This is a positive sign, and if it can maintain this bullish sentiment, we could see it trading near levels around 50 soon.
NEO is currently the 45th largest cryptocurrency, with a market capitalization of $2 Billion. NEO was initially known as “Antshares” when it was launched in China in 2014, as the first-ever public blockchain. It then rebranded to NEO a few years later.
Trade Idea: Buy the continuation in NEO
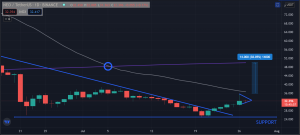
Given the recent breakout of the short-term downtrend line that formed from May to July, we may see a further continuation of the NEO rally. I predict that NEO will enter a few pause days, where we will see flat to slightly bearish trading and low volatility, before it moves higher, ideally forming a flag pattern in the next 2 to 4 days.
This trade idea would capitalize on the bottoming and the further rally towards a significant resistance area for NEO.
Buy a tranche on the first green candle, and add another tranche as it hits 35-36 and breaks higher, above the 50-day moving average (gray line). The target price is the strong dynamic 200-day moving average (purple line) and coincidentally, the psychological round number of 50.00 – take profits in this area.
Put a tight stop at 29.00. A fall from this level could mean it revisiting the 25.00 support level again.
Trade Summary:
Buy:
Tranche 1 – first green candle after a few pause days
Tranche 2 – 35 to 36 as it rallies and breaks above the 50-day moving average
Target Price: 50.00 (200-day moving average, psychological round number, and 23.6% Fibonacci retracement level.
Stop loss: 29.00 tight stop
VAR: 0.50 – 1.00% of your portfolio
- Check out our free forex signals
- Follow the top economic events on FX Leaders economic calendar
- Trade better, discover more Forex Trading Strategies
- Open a FREE Trading Account
- Read our latest reviews on: Avatrade, Exness, HFM and XM
Related Articles


Sidebar rates
Related Posts
