Wait for Another Pullback Down in Neo Coin Before Buying Long-Term, as all Charts Point up?
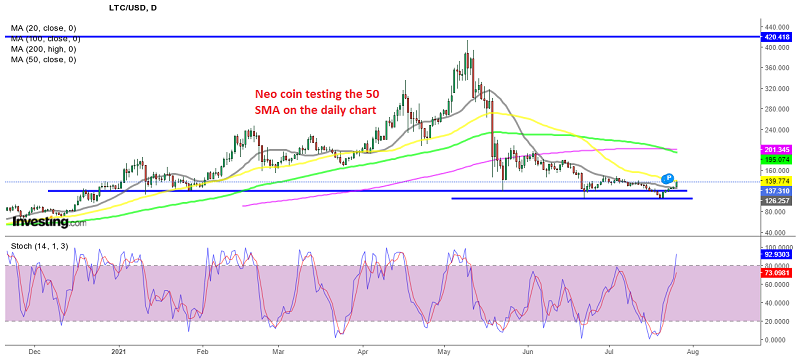
The Neo coin has broken above the 20 daily SMA which used to act as resistance, but is facing the 50 SMA now
Cryptocurrencies have been on a strong bearish trend for more than two months, since the crash in mid-May, but it seems like the decline could be over. They were able to put up a decent pullback in recent weeks, especially in July, which was painting a really negative picture for the crypto market, particularly as the war on cryptos by the banking establishment continues.
But, it seems like the public and large businesses are going ahead with cryptocurrencies, and the situation is improving. In fact, the trend might be shifting right now, with most cryptos making some decent gains for several days, and breaking above indicators, which have been providing resistance during this bearish period.
The NEO/USD pair was on a bearish correction below the May 2021 high level of $147.77, as we highlighted in our 2021 Neo forecast. On the technical front, the pair was trading slightly bearishly, with the 20 SMA (gray) continuing to provide resistance at the top. This moving average acted as resistance, together with the 50 SMA (yellow) during this 2-month downtrend, but, buyers have managed to push the price above this moving average, which indicates that the bearish trend might be over. A retest of this moving average from above would be a good opportunity to buy Neo, specially after looking at the larger time-frame charts, which are pointing towards a bullish reversal too.

NEO/USD Weekly Time-frame – Oversold Zone
The weekly chart also supports the idea of a bullish reversal soon. After coming down for two months, the 100 SMA (green) has been holding twice as support and is not letting go. Last week’s candlestick looks like a pin, which is also a bullish reversing signal. Besides this, the stochastic is severely oversold too. The 200 SMA (purple), which has just appeared, is also adding more strength to the 100 SMA at around $25, as support.

NEO/USD Monthly Time-frame – Oversold Zone
The monthly chart has turned quite bearish in the last two months, after the surge earlier this year, which is a similar picture to the reversal we saw in 2018. The previous high was broken this time, but Neo crashed, as did the entire crypto market. However, the 20 SMA (gray) is acting as support again here, as it did late last year. The stochastic indicator has also become oversold, which points to a bullish reversal as well. So, we are thinking about opening a long-term buy signal in NEO/USD soon, which you can follow on our forex signals page.
- Check out our free forex signals
- Follow the top economic events on FX Leaders economic calendar
- Trade better, discover more Forex Trading Strategies
- Open a FREE Trading Account
- Read our latest reviews on: Avatrade, Exness, HFM and XM
Related Articles


Sidebar rates
Related Posts
