Bitcoin Cash (BCH): Bullish Flag Spotted
*BCH daily timeframe: trading in a range
After falling from all-time highs of 1,650 earlier this year, BCH has fallen to a low of 383 this year, but it looks like the selling pressure has died down and we may have seen the bottom now.
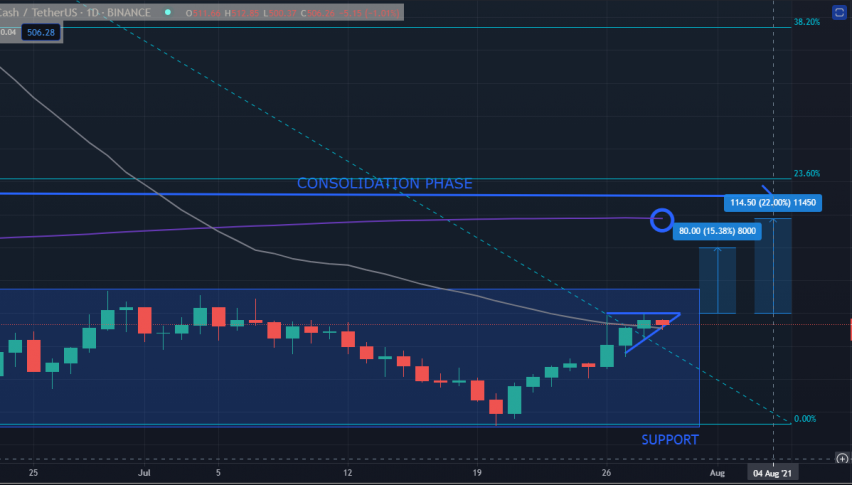
BCH has been trading in a relatively tight range between 383 and 550 in the past month. Price action would suggest that BCH may already be in a consolidation phase, after declining early this year.
Just this past week, Bitcoin (BTC) surged to 40,000, after trading below 30,000 a week before. This spearheaded the recent cryptocurrency rally most coins are experiencing right now. At the same time, BCH has rallied from its lows to trade above the psychological resistance number of 500, which is a gain of more than 30% in a week.
The sentiment for BCH is still quite bearish, because it is still trading the long-term 200-day moving average, but the recent rally is a welcome sign for the bulls. We may see a potential continuation of the rally towards this moving average in the near future.
Trade Idea: Buy BCH at the 50-day Moving Average

As long as BCH holds above the 50-day moving average (gray line), I believe this could still have legs to pull through towards its next resistance. Here are the key resistance levels:
-
-
- High of the short-term consolidation: 550
- Round Number Psychological Resistance: 600.00
- 200-day moving average: 637.00 (this changes every day)
- 23.60% Fibonacci Retracement: 680 to 700
-
BCH has been forming a flag pattern in the past three days. You can take a quick short-term momentum trade here. Buy as it moves past 520 (the high of the flag pattern), for a play on a possible continuation. The assumption is that it will continue its rally to break the upper bounds of the recent short-term consolidation of 550.
The target price is the initial 600, but it could reach the 200-day moving average and overshoot it to the 23.60% Fibonacci level if the rally is indeed strong. Take profits as the price moves higher. It’s very unlikely that it will trade to 1,000 in the next few weeks, and the overall trend is still bearish to neutral.
Set your stop loss at 480.00 (low end of the flag), as this negates this idea after it breaks higher. Do not enter the trade if it does not break above 520.
Trade Summary:
Buy: 520 (high of the flag)
Stop-loss: 480 (low of the flag)
Target Price:
-
-
-
- 600: Psych resistance level
- 637: 200-day moving average
- 680 to 700: 23.60% Fibonacci retracement level
-
-
- Check out our free forex signals
- Follow the top economic events on FX Leaders economic calendar
- Trade better, discover more Forex Trading Strategies
- Open a FREE Trading Account
- Read our latest reviews on: Avatrade, Exness, HFM and XM
Related Articles


Sidebar rates
Related Posts
