MAs Have Turned into Support for Ethereum, Pushing it Higher, Albeit Slowly
Moving averages are pushing Ethereum higher, keeping the momentum bullish
Ethereum has been the second most important cryptocurrency for about a decade, after Bitcoin, although it took the lead in May, as it kept pushing higher, while Bitcoin stagnated. This showed that Ethereum remains in a strong position, especially since it is the main network upon which many crypto token projects rely.
However, it had crashed together with the rest of the crypto market by the middle of May, after the war on cryptocurrencies came to the surface, particularly in China, which is implementing heavy crackdowns. But some Western countries and Japan have also taken legal action against cryptocurrencies and crypto exchanges.
Ethereum Live Chart
So, cryptos, including Ethereum, were really bearish for more than two months, until early last week, when they made a sudden reversal. There were a few comments that turned out to be positive for the crypto market, although crypto traders might have taken the “go ahead” signal from Elon Musk, who started using the Dogecoin meme as his Twitter profile picture. That might explain the sudden reversal in the crypto market sentiment, because Amazon has already rejected the rumours that it will accept Bitcoin and then other cryptocurrencies for payments.
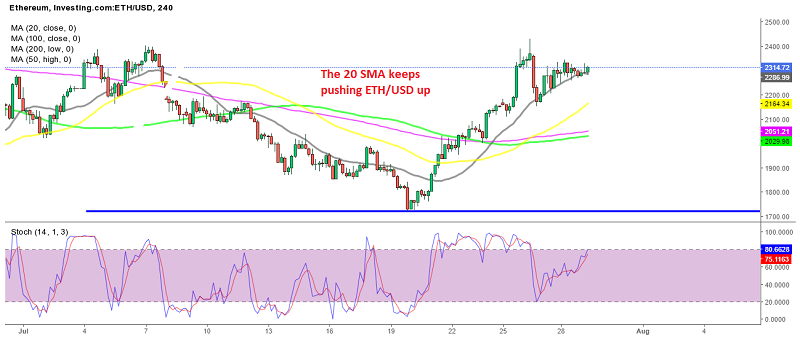
The sentiment seems to have turned positive, particularly for ETHEREUM, which is finding solid support at the 20 SMA (gray) on the H4 chart at the top of this article. This moving average acted as resistance during the decline in the ETH/USD, but now it seems to have turned into support, pushing the price higher.
Ethereum Analysis – ETH/USD Daily Chart

Ethereum bounced at the 100 SMA on the H1 chart today
On the H1 chart above, all moving averages are providing support, with the 100 SMA (green) recently having turned into the ultimate support. The ETH/USD keeps bouncing off this moving average, so the bullish momentum continues here, despite Bitcoin being unable to hold above $40,000. The trend hasn’t turned bullish in larger charts, and this is not going to happen until the price moves above the 100 SMA on the daily chart, and above $2.430, so caution is advised, but buying against the 100 SMA on the H1 chart is not a bad idea.
- Check out our free forex signals
- Follow the top economic events on FX Leaders economic calendar
- Trade better, discover more Forex Trading Strategies
- Open a FREE Trading Account