Signs of Weakness in Cardano ADA, Chainlink Moves Above the 50 Daily SMA
Chainlink is looking more bullish than Cardano, which is failing to move above the 50 daily SMA

Cardano and Chainlink were in a steep decline over the last couple of months, starting in the middle of May. LINK/USD lost more than 75% of its value from the top, as it kept making new lows until early last week, while ADA/USD lost around 60% of its value.
But early last week, we saw a reversal in the cryptocurrency market, after a number of positive comments/rumours circulated, especially about Amazon accepting Bitcoin for payments, to be followed at some point by Cardano, which improved the sentiment. Despite the fact that the company has rejected those claims, they were enough to reverse the trend from quite bearish to bullish. We did see a dive after the comments by Amazon, rejecting the idea, which reversed Bitcoin from above $40,000, sending it down to $36,300, but the sentiment in the crypto market has already turned bullish and that rejection by Amazon couldn’t stop the bullish push.
Cardano Analysis – ADA/USD Daily Chart

The 50 SMA is keeping ADA/USD subdued on the daily chart
ADA/USD reversed from the bottom of the range above $1, and is now heading for the top of the range, although, Cardano buyers seem sort of weak this week, and unable to push above the 50 daily SMA (yellow), while the 100 SMA (green) and the top of the range stand ready to provide resistance at the top.
The Cardano (ADA) network is set to become browser and mobile-compatible in the near future, thanks to a new upgrade that the team behind the project is working on. The upgrade will allow users to run the Plutus application, backed in Javascript. This is, the most widely-used programming language on the web. The roll-out of smart contracts will enable the Cardano network to compete with other main networks, such as Ethereum and the Binance Smart Chain.
Cardano Live Chart
But, apart from the big bullish candlestick on Tuesday last week, the other candlesticks have been really small, particularly the last few, indicating that we might see a reversal back down soon. So, the price action does not support the recent developments in Cardano, which is implementing the Alonzo hard fork as well.
Chainlink Analysis – LINK/USD Daily Chart

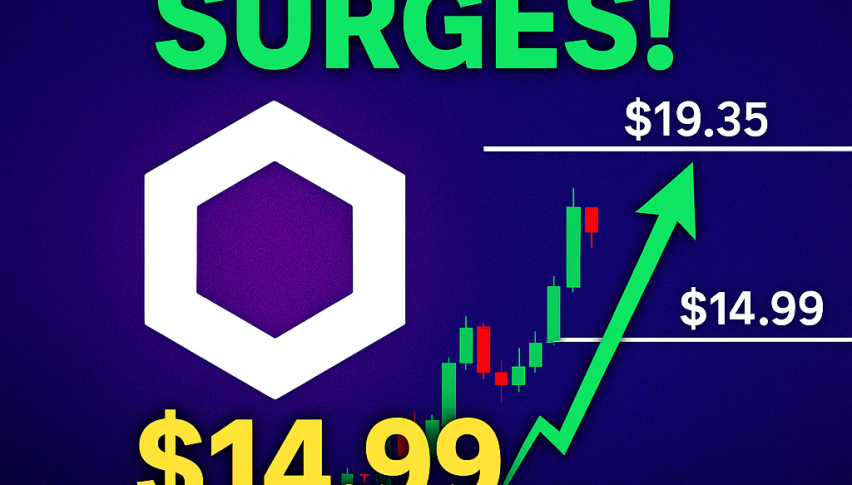
Chainlink keeps gains above the 50 daily SMA
Chainlink, on the other hand, has made quite a climb during this time. LINK/USD pushed above the 20 SMA (gray) on the daily chart, and on Tuesday this week, it moved above the 50 daily SMA (yellow) as well. The stochastic indicator is overbought on this chart, but Chainlink is not showing any signs of a reversal. Yes, the climb has stalled right now, but if Bitcoin resumes the bullish momentum again soon, Chainlink will follow suit.
- Check out our free forex signals
- Follow the top economic events on FX Leaders economic calendar
- Trade better, discover more Forex Trading Strategies
- Open a FREE Trading Account