Going Long on Bitcoin After Today’s Pullback
Bitcoin has retreated down, but the chart setup points to a bullish reversal soon
The sentiment in cryptocurrencies has turned bullish since Wednesday last week, after the quick reversal higher in this market. Some cryptocurrencies have been making higher highs during this time, with Ripple XRP gaining around 50% of its value and Polygon Matic nearly doubling in value, while the Axie Infinity token AXS has quadrupled since 10 days ago.
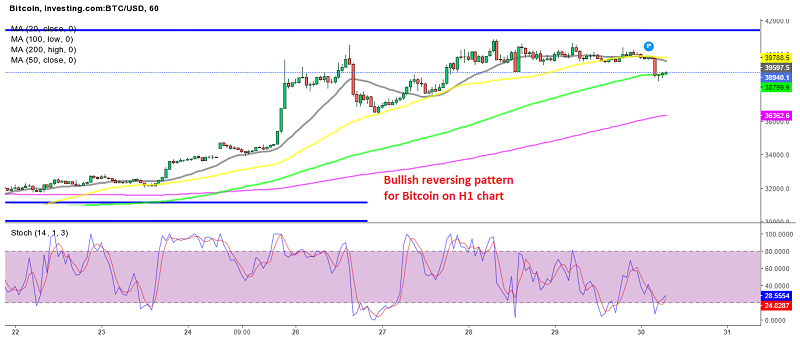
Bitcoin also reversed higher, first breaking above the moving averages that were keeping this cryptocurrency down during July, so that was the first sign that the sentiment in this market was improving. Then moving averages turned into support for Bitcoin, particularly the 20 SMA (gray) and the 50 SMA (yellow), which kept pushing the price higher.
BTC/USD eventually climbed above $40,000, after failing to do so for more than a month, since the sentiment was quite bearish in July until the bullish reversal. But, the area from $40,000 until $41,000 has provided solid resistance for several months now, and Bitcoin hasn’t been able to push above it during this bullish momentum.
Bitcoin Live Chart
We have seen several pullbacks down from that resistance zone, but buyers have returned and pushed BITCOIN back up again, which saw it bouncing off the 50 SMA, and today, we saw another pullback, which took the price below the 50 SMA for the first time since the reversal from below $30,000 more than a week ago.
But, it seems like the pullback might have ended at the 100 SMA (green) on the H1 chart now. BTC/USD formed a pin candlestick at that moving average, which is a bullish reversing signal after the retreat down. The stochastic indicator is also oversold, suggesting that the retrace is complete.

The 20 SMA has turned into support on the 5-minute chart
So we decided to take a long position in Bitcoin, targeting the resistance zone, which is around $2,000 higher from the bottom of the pullback. We switched to the 5-minute chart to pick a good entry point. The 20 SMA (gray) rejected the price on the 5-minute chart on the first attempt at reversing up, but gave way on the second attempt, and we decided to buy once the BTC/USD moved above the 20 SMA, which turned into support on the 5-minute chart. So, now we are waiting for the price to move above the 50 SMA and eventually above all the MAs, in order to book profit near the top.
- Check out our free forex signals
- Follow the top economic events on FX Leaders economic calendar
- Trade better, discover more Forex Trading Strategies
- Open a FREE Trading Account
- Read our latest reviews on: Avatrade, Exness, HFM and XM
Related Articles

Sidebar rates
Related Posts
