Has the Bullish Momentum Ended for Ripple XRP, as MAs Turn From Support into Resistance?
Ripple coin is finding resistance at moving averages, which point to a bearish reversal soon
Ripple coin was quite bearish from the middle of June until the middle of July, although it started the reversal down earlier than some other other cryptos, topping out in April, while Ethereum ETH continued to make higher highs until May. As a result, it lost around 75% of its value, declining from below $2 to just above $0.50.
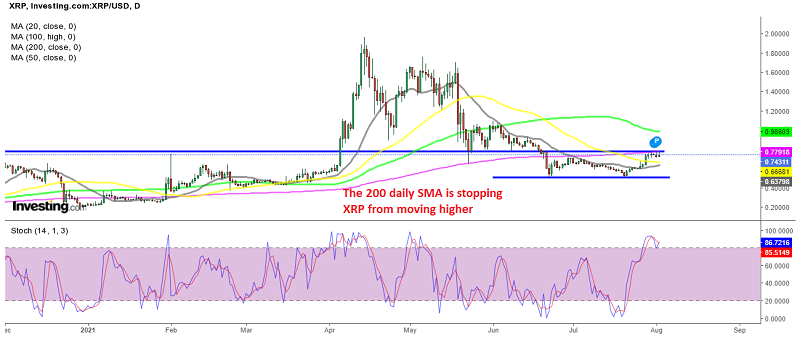
Ripple Analysis – XRP/USD Daily Chart
The decline was quite strong, with the smaller moving averages, such as the 20 SMA (gray), providing resistance on the daily chart, showing that sellers were in control the whole time. But, about two weeks ago the sentiment suddenly changed for cryptocurrencies, and the crypto market turned bullish.
The XRP/USD moved above the 20 daily SMA, breaking above the 50 SMA (yellow) as well. However, buyers have failed to push above the 200 SMA (purple) on this chart. RIPPLE coin has made several doji candlesticks just below that moving average, which has turned into resistance. The stochastic indicator is also overbought, suggesting a possible reversal down, so Ripple is forming a bearish reversing pattern on the daily chart.
Ripple Live Chart
Ripple Analysis – XRP/USD H4 Chart
Turning to the H4 time-frame chart, we see that the 20 SMA (gray) has turned into support during the last two weeks, showing that the buying pressure has been strong as well. But yesterday, Ripple coin reversed down, following the pullback in Bitcoin and other main cryptos, which saw the XRP fall below the 20 SMA.

The 20 SMA has turned into resistance for XRP on the H4 chart
Today, buyers tried to resume the bullish trend, pushing briefly above the 20 moving average, but eventually, the candlestick closed below it, and now the price is reversing back down. This shows that the 20 SMA has turned into resistance now, and we might see a deeper pullback down to the 100 SMA (green) and the 200 SMA (purple), which coincide with the 50 SMA (yellow) on the daily chart at the top.
So if that happens, the $0.64-65 area is a good place to look for longs, especially if Ripple forms a bullish reversing signal after the pullback. But, first, we need to wait and see whether sellers can take the price down there. The XRP/USD is not falling too fast, so there isn’t much selling pressure, but let’s observe the price action with this plan in mind. If sellers fail and the Ripple coin moves above the 200 daily SMA, that would be a signal to buy.
- Check out our free forex signals
- Follow the top economic events on FX Leaders economic calendar
- Trade better, discover more Forex Trading Strategies
- Open a FREE Trading Account
- Read our latest reviews on: Avatrade, Exness, HFM and XM
Related Articles


Sidebar rates
Related Posts
