A Bullish Case for Ankr Network (ANKR)
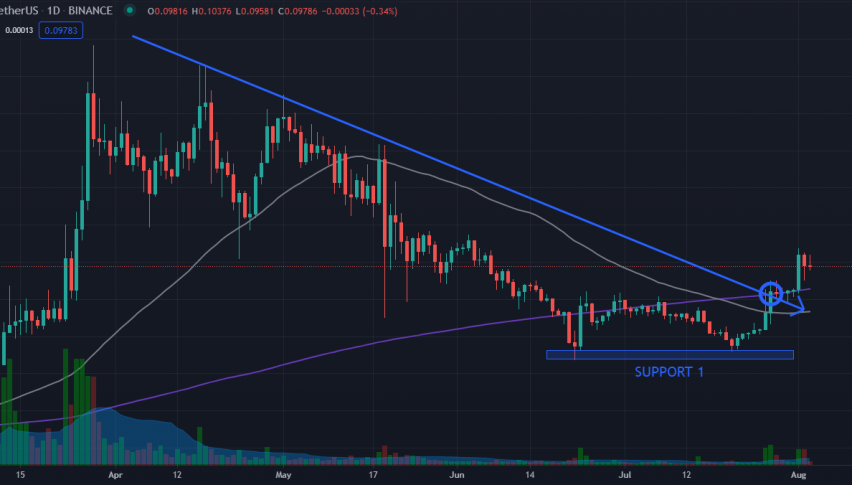
* ANKR Chart – Daily Timeframe (Aug. 3, 2021): Breaking out of a long downtrend line
The cryptocurrency market has been on a strong rally in the past few weeks, with Bitcoin (BTC) trading above 40,000 again, after dropping below 30,000 the week before. Most major cryptocurrencies and altcoins followed suit as well.
ANKR rallied to a high of 0.10727 on the first day of August, which was a 125% gain from its recent low of 0.04761 last June. Given the recent rally, there is a higher probability that we may have seen the bottom for ANKR this year.
The bearish bias for this coin seemed to be getting less and less, as it managed to break out of its long-term downtrend that began in April 2021. Furthermore, at the time of writing, it was trading above its 200-day moving average. The momentum indicator, the Average Directional Index of 31.89, suggests there may still be some room for ANKR to rally in the short term.
As traders, we try not to predict price movements; rather, we react to them and play the probabilities. The key is to be prepared with a trading plan in every possible situation that could occur. Currently, I see two probable situations that could arise for ANKR. First, it could break out of a momentum flag pattern and continue its rally to the next resistance level, or alternatively, it could sell down and revisit critical support areas. I believe it is better to be prepared for both situations.
ANKR Trade Idea: Buy the continuation flag pattern
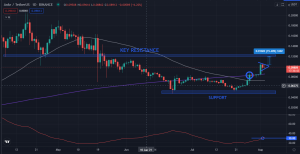
The first trade idea is to buy the breakout of the continuation flag pattern for a quick momentum trade. Buy 0.1040-0.1050 with a target price of 0.1200, which is the nearest key resistance level. This level acted as a key support at least 4x during its consolidation from March to May, before breaking down below it. It is also the 50.00% Fibonacci retracement level, so expect traders to be taking profits in this area. If the trade works well, take profits on the way up.
Remember that this is a quick, short trade only, so put a tight stop at the bottom of the flag pattern at 0.09020. The trade is invalidated if it falls below this, but you can sell half of the position if it looks like it will not follow through. The next support area, if the correction continues, would be the 200-day moving average (purple line). Expect it to revisit this area if the trade does not follow through. Risk only 0.50 to 1.00% of your portfolio for this trade.
Trade Summary:
Buy: 0.1040 to 0.1050 (Rally above the flag pattern)
Stop loss: 0.09020 (This is the maximum stop loss, sell half if it looks like it will not follow through.
Target Price: 0.1200 (take partial profits on the way up)
ANKR is the 99th largest cryptocurrency, with a market capitalization of $563 million. It is a network solution that provides blockchain hosting for developers and enterprise clients at a cheaper cost. It was founded by Chandler Song, Stanley Wu and Ryan Fang at the Berkeley University in California in 2017 .
- Check out our free forex signals
- Follow the top economic events on FX Leaders economic calendar
- Trade better, discover more Forex Trading Strategies
- Open a FREE Trading Account
- Read our latest reviews on: Avatrade, Exness, HFM and XM
Related Articles


Sidebar rates
Related Posts
