Gold Ascending Triangle Breakout – Brace for a Sell Trade
Today in the Asian trading session, the yellow metal price failed to halt its previous-day losing streak and drew further offers below the $
Written by:
Arslan Butt
•
Friday, August 6, 2021
•
3 min read
•
Last updated: Friday, August 6, 2021

Today, during the Asian trading session, the yellow metal price failed to halt its losing streak of the previous-day, drawing further offers below the $1,800 mark. However, the strong rebound of the US Treasury yields and record equities has played a significant role in undermining the GOLD prices. The firmer US dollar was seen as another factor that kept the gold prices under pressure. This can be attributed to the inverse relationship between gold and the dollar.
Apart from this, the upbeat market mood has diminished the safe-haven demand, which makes the gold prices even weaker. The risk sentiment got some lift right after the US released surprisingly positive jobless claims data. In addition to this, the discussions over how close the US Senate is to announcing the much-awaited infrastructure spending plan added further optimism to the market trading sentiment.
In contrast, the multi-day high in coronavirus figures from the US, China and Australia, keeps challenging the market trading sentiment. This may help to limit deeper losses in the bullion prices. Gold is trading at 1,799.60 and consolidating in the range between 1,799.19 and 1,804.88.
Upbeat US Data & US Senate Updates
Despite the ever-increasing coronavirus numbers from the US, China and Australia, the market trading sentiment was able to extend its positive performance of the previous day, remaining well bid on the day. Be it chatter over the announcement of the much-awaited infrastructure spending plan, which is expected to be released by the US Senate soon or the previously released upbeat US data, everything seems in favor of the market risk sentiment.
On the data front, the ADP non-farm employment change was at 330,000 in July, the services purchasing managers’ index (PMI) was 59.9, the Institute of Supply Management (ISM) non-manufacturing employment was at 53.8, and the ISM non-manufacturing PMI was at 64.1. Meanwhile, investors also cheered a decline in US initial jobless claims, with 385,000 claims having been submitted during the past week.
Thus, the risk-on mood and the firmer USD will keep GOLD under pressure, ahead of the key US employment data due to be released. However, any disappointment generated by the jobs report could reverse the latest losses in gold.
The Bullish US Dollar & the Gold Price
Despite the somewhat brighter market mood, the broad-based US dollar managed to pick up positive traction, remaining well bid ahead of the US jobs report. The data could see the US tighten its monetary policy earlier than Europe and Japan, where the prospect remains distant. Previous comments by US Federal Reserve Vice Chair, Richard Clarida, stating that conditions for an interest rate hike could be met in late 2022, led to a closer focus on the recovery of the labor market from the COVID-19 disaster.
Meanwhile, the previously released positive US data boosted the prices of the greenback, with the upticks in the US dollar keeping the bullion prices under pressure, as the price of gold is inversely related to the price of the US dollar.
The multi-day high in coronavirus figures from the US, China and Australia keep challenging the market mood, which may support the prices of the safe-haven metal, gold. As per the latest report, the number of COVID infections in the US has risen to a 6-month high, while China has recorded the highest daily rise in the number of coronavirus cases during the current outbreak. Besides this, Australia’s daily COVID numbers have also hit the highest levels since August 2020, with the national total being around 307, according to the latest information.
Looking ahead, the market traders will keep their eyes on the US economic docket, which highlights the release of key US jobs reports due for publishing on the day. Meanwhile, the preliminary figures of Japan’s Leading Economic Index for June, expected to come in at 102.7 against 102.6 prior, may be seen as key catalysts to offer near-term direction to the market trading mood.

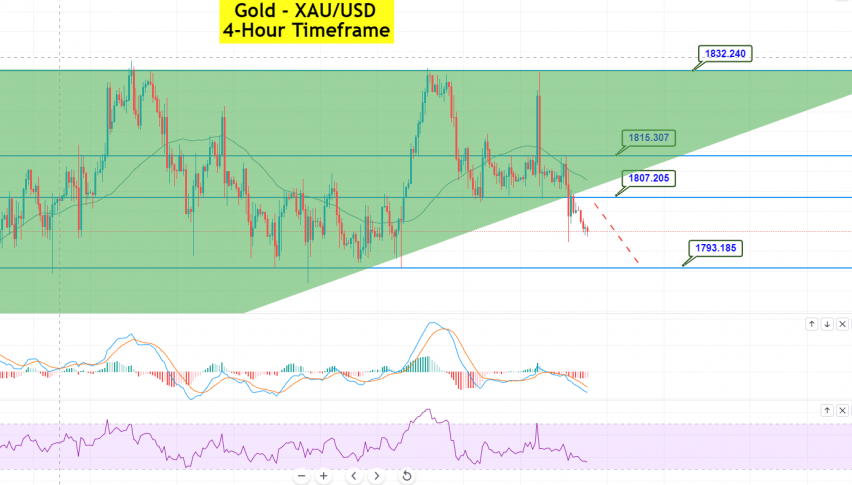
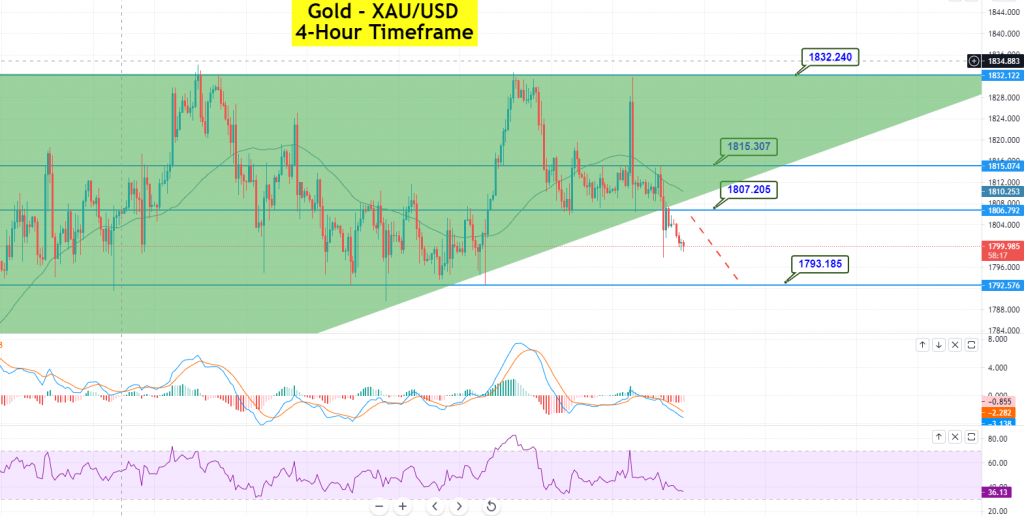
Gold – XAU/USD – Daily Support and Resistance
S3 1,771.46
S2 1,788.57
S1 1,796.4
Pivot Point: 1,805.69
R1 1,813.51
R2 1,822.8
R3 1,839.91On Friday, the yellow metal,
GOLD, is trading with a bearish bias at a the $1,801 level. Gold has already violated the support level of $1,807, which was extended by an upward trendline. Moreover, the ascending
triangle pattern has also been violated, and the closing of candles outside this triangle suggests odds of a continued bearish trend.
On the lower side, the precious metal may find support at the $1,797 level, and a breakout at this support is likely to lead the price towards the $1,793 level. At the same time, the resistance remains at $1,807. Let’s consider staying bearish below $1,807 today. Good luck!
Arslan Butt
Lead Markets Analyst – Multi-Asset (FX, Commodities, Crypto)
Arslan Butt serves as the Lead Commodities and Indices Analyst, bringing a wealth of expertise to the field. With an MBA in Behavioral Finance and active progress towards a Ph.D., Arslan possesses a deep understanding of market dynamics.
His professional journey includes a significant role as a senior analyst at a leading brokerage firm, complementing his extensive experience as a market analyst and day trader. Adept in educating others, Arslan has a commendable track record as an instructor and public speaker.
His incisive analyses, particularly within the realms of cryptocurrency and forex markets, are showcased across esteemed financial publications such as ForexCrunch, InsideBitcoins, and EconomyWatch, solidifying his reputation in the financial community.
Levi Strauss, FedEx, Jefferies Financial Group, Micron Technology, and BlackBerry are at the top of a busy earnings week that includes companies in the semiconductor, logistics, banking, and consumer discretionary industries.