Polkadot DOT/USD Doubles in Value, Axie Infinity AXS Surges 450% in 3 Weeks
Axie Infinity leading the crypto bulls, Polkadot follows
After the cryptocurrency crash in May and the bearish momentum in June and July, the crypto market seems to have resumed the bullish trend that started at the beginning of this year, once again. All cryptocurrencies have turned bullish, with some of them having started their surge on July 21, when the reversal started.
Polkadot Analysis – DOT/USD Daily and Monthly Charts
Polkadot kept making new lows over the previous three months, confirming the selling pressure, while moving averages were providing resistance during pullbacks on the daily chart. At some point, Polkadot fell to $10.40, from a high of almost $50, in the middle of May. But the reversal came in late July, bringing an end to the bearish times. DOT/USD broke above the 20 SMA (gray) and the 50 SMA (yellow), without much resistance from them, which shows that the buying pressure was strong, and it climbed to $22, and as my colleague Aiswarya pointed out, this is a gain of more than 100% in value.

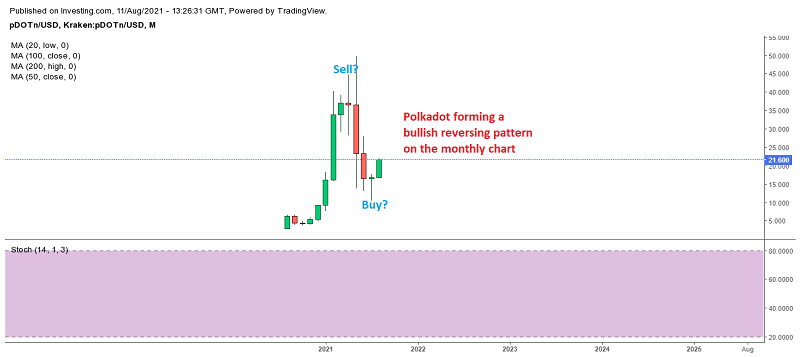
Polkadot now facing the 100 SMA on the daily chart
On the monthly Polkadot chart, the pattern looks quite bullish as well. Polkadot formed a doji candlestick in April – this is a bearish reversing signal – and it reversed in May, losing nearly 75% of its value in the following months. Now, it has formed a pin candlestick at the bottom – this time a bullish reversing signal after the decline – and the reversal seems to be underway already. So, both charts point up for DOT/USD.
Axie Infinity Analysis – AXS/USD Daily Chart

AXS/USD has bounced off the 20 daily SMA again
But the climb in Polkadot seems pretty small when compared with Axie Infinity, which has been absolutely surging in the last three weeks. AXS/USD surged from around $5 on July 1 until almost $30 by the middle of last month. In the third week, we saw a reversal lower to $14, which we bought, based on the daily chart.
The 20 SMA (gray) was providing support and the price bounced off this moving average. Axie surged to $50 first, then came $56, and now this cryptocurrency has moved above $78. So, AXS/USD has surged nearly 4.5 times higher in the last three weeks. We booked profit on our trade here. This digital token is providing some great buying opportunities!
Axie Infinity Token Live Chart
[[AXS/USD-graph]]
- Check out our free forex signals
- Follow the top economic events on FX Leaders economic calendar
- Trade better, discover more Forex Trading Strategies
- Open a FREE Trading Account