Gold Continues the Bullish Momentum After Negative US Retail Sales, but Faces MAs Above
Gold has turned bullish after the crash, but it is facing some major obstacles above
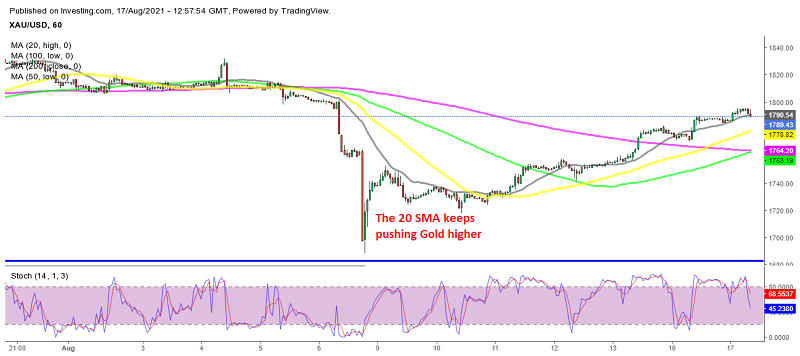
Gold went through a major decline earlier this month, crashing from $1,830 to $1,685 after a pin candlestick below the 200 SMA on the daily chart. The decline was pretty fast, but it didn’t last, and gold reversed right at the previous low, so the zone above $1,680 has turned into a great support and buying area.
The price reversed down there, and it has been moving higher continuously since, making up for the decline. The 20 SMA (gray) has been doing a great job as support during the last week, pushing the price higher on the H1 chart. Although, as shown on the H4 chart below, GOLD is facing the 200 SMA on the H4 chart. The US retail sales showed a decline in July, which was another negative report for the USD, although the CPI (Consumer Price Index) inflation report is the one everyone is waiting for, because the FED is basing its decision on inflation. Below is the retail sales report.

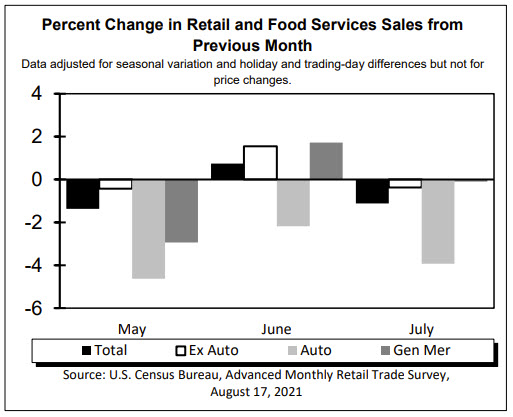
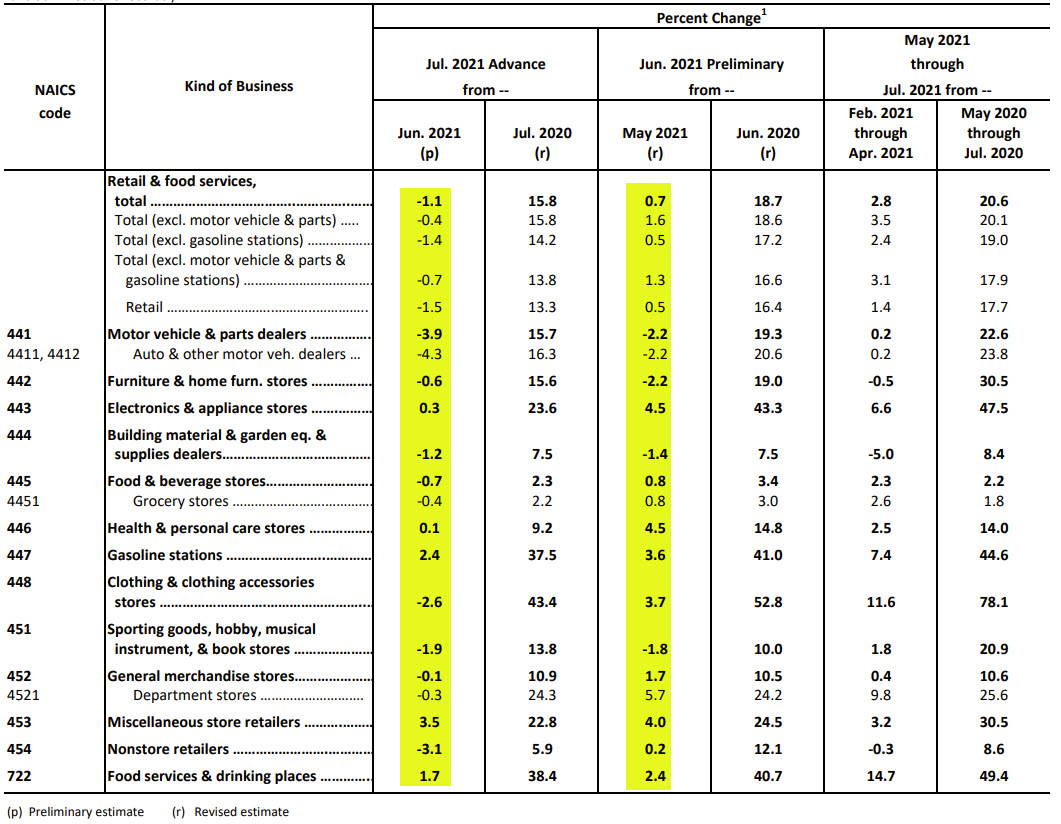
US July 2021 Retail Sales Report
- Prior was 0.6% MoM (revised to 0.7 %)
- Retail sales MoM -1.1% vs 0.2% estimate
- Retail ex autos -0.4% vs 0.2% estimate
- Prior ex autos 1.3% (revised to 1.6%)
- Retail sales control group -1.0% vs 1.1 last month
- Retail sales ex auto and gas -0.7% vs 1.4% prior (revised from +1.1%)
- Full report
Retail Sales Details:
- Motor vehicles and parts dealers -3.9% versus -2.2% last month
- Furniture and home furniture stores -0.6% versus -2.2% prior
- Electronics and appliance stores +0.3% versus 4.5% prior
- Building materials and garden equipment and supplies dealers -1.2% versus -1.4% prior
- Food and beverage stores -0.7% versus +0.8% prior
- Health and personal care stores 0.1% versus 4.5% prior
- Gasoline stations +2.4% versus +3.6% prior
- Clothing and clothing accessories -2.6% versus +3.7% prior
- Sporting-goods hobbies musical instruments -1.9% versus -1.9% prior
- General merchandise stores -0.1% versus +1.7% prior
- Miscellaneous +3.5% versus +4.0%prior
- Non-store retailers -3.1% versus +0.2%
- Food services and drinking places +1.7% versus +2.4% prior
Gold Live Chart
- Check out our free forex signals
- Follow the top economic events on FX Leaders economic calendar
- Trade better, discover more Forex Trading Strategies
- Open a FREE Trading Account


