USD/CAD Continues the Bullish Move Despite Inflation Jumping Higher in Canada
MAs keep pushing USD/CAD higher even as inflation jumps in Canada
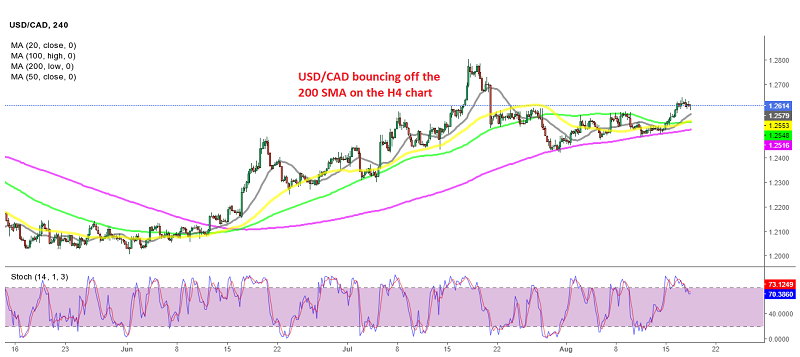
The USD/CAD was on a bearish trend for more than a year, from March last year when it was trading above 1.46, until June this year when it fell to 1.20. That area turned into support and the USD/CAD reversed from that big round number.
It has been climbing higher since then, despite the USD going through smaller periods of weakness. Moving averages turned into support, particularly the 100 SMA (green) on the H4 chart, when the uptrend was strong in July, while in August the 200 SMA (purple) came into play as the trend slowed. This week, it seems like the USD/CAD is resuming the bullish trend, after bouncing off the 200 SMA, and the jump in Canadian inflation figures didn’t hurt the sentiment much.
USD/CAD Live Chart
Crude oil has turned bearish, and now WTI oil is threatening the support area above $0.65, which is keeping the Canadian Dollar down. So, the sentiment has turned bullish for this pair, with fears of COVID restrictions/lockdowns keeping the sentiment bearish for risk currencies, such as the commodity dollars. So, we will try to buy USD/CAD on a retrace lower to the 200 SMA.
Canadian consumer price index data for July
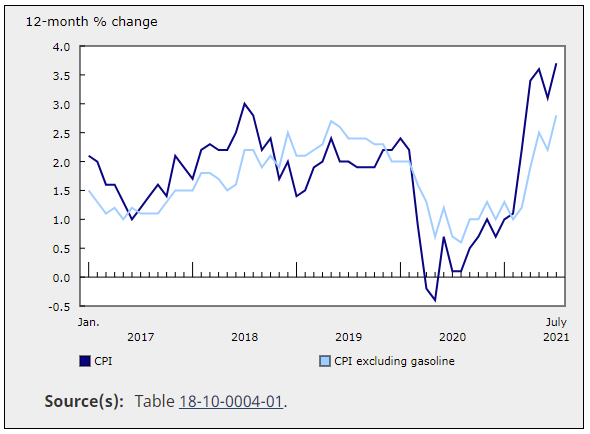
- Canada CPI YoY for July came in at 3.7%, versus 3.1% last month
- CCPI YoY in June was 3.1%
- CPI MoM 0.6% vs 0.3% last month. Estimate 0.3%. This was the fastest pace since January 2021
- CPI year on year rose 3.8% versus 3.1% in June
- Core CPI excluding gasoline increased 2.8% year on year
- Full report
- Median 2.6% versus 2.4% last month. Estimate 2.4%
- Common 1.7% versus 1.7% last month. Estimate 1.8%
- Trimmed 3.1% versus 2.6% last month. Estimate 2.5%
- The homeowners replacing costs index rose at its fastest rate since 1987, going up by 13.8% year-over-year in July. That was the largest yearly increase since October 1987
- Gasoline prices also rose, but at a slower pace. The year-on-year increase is at 30.9% versus 32.0% last month. Gasoline prices increased 3.5% month over month in July, as the OPEC supply remained below pre-pandemic levels, though global demand increased
- Check out our free forex signals
- Follow the top economic events on FX Leaders economic calendar
- Trade better, discover more Forex Trading Strategies
- Open a FREE Trading Account


