Uniswap (UNI): Potential Golden Cross Soon?

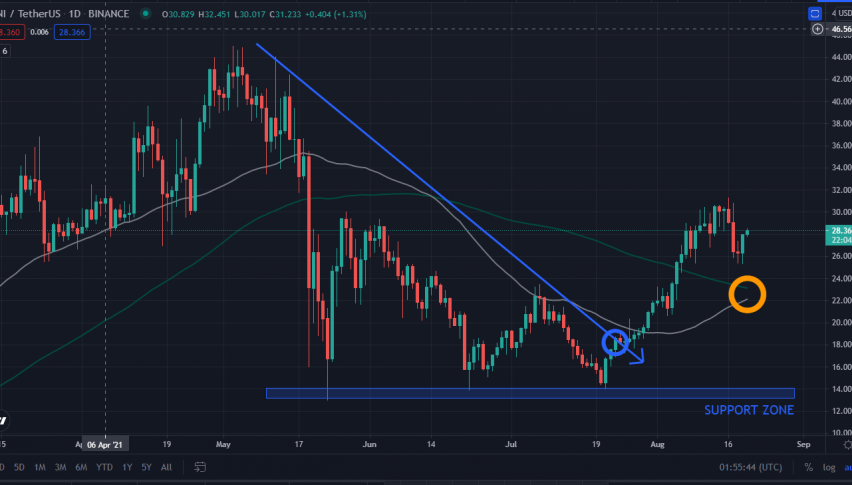
UNI Daily Timeframe Chart: Rallied higher above the downtrend line, potential Golden Cross
UNI has been on a downtrend since the highs of May 2021, and for the past few months, it has established a buying support at price levels of 13.00 to 14.00. It bounced above this area again in late July, for the third time this year (see table below). I believe it has now established this support zone as the bottom for this year’s correction, as the overall health of the cryptocurrency market has turned bullish lately.
UNI has bottomed at the 13.00-14.00 support this year
| UNI | Bounce Low | Rally Peak | Low to Peak | Bounce |
| # | Date Price | Date Price | % Gain | Duration (days) |
| 1 | May 23 13.00 | May 27 30.00 | 131% | 4 |
| 2 | June 22 13.93 | Jul 7 23.47 | 68% | 15 |
| 3 | Jul 21 14.01 | Aug 16 31.26 | 123% | 26 |
What was initially thought to be a relief rally, proved to be stronger, and my bias for UNI has improved to neutral-bullish. I would like to see a proper consolidation or range trade in the next few weeks to months, although a sharp rally would not hurt either, although it is most likely to be unsustainable if it happens.
Potential UNI Golden Cross as the 50-day MA moves towards the 100-day MA
Furthermore, a “Golden Cross” appears to be forming for UNI in the near future. A “Golden Cross” is a bullish indicator used by technical analysts to determine the current and future trends of financial securities. This happens when a short-term moving average crosses above a longer-term moving average.
In the case of UNI, the 50-day moving average (gray line) seems to be heading towards a cross above the 100-day moving average (green line), to form a Golden Cross. If this happens in the near future, it will further strengthen the bullish thesis for UNI.

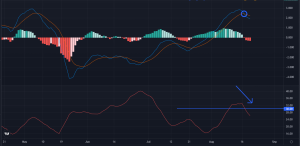
UNI: MACD crossdown, ADX has fallen below 30, suggesting a slowdown in momentum
Looking deeper into UNI’s technicals, its MACD has now crossed down, which suggests a possible slowdown in its current rally. At the same time, its Average Directional Index (ADX), a momentum indicator, has fallen below 30, and is heading further down, which also suggests the same. UNI is most likely to correct and consolidate above the 20.00 area.
What to do?
Congratulations if you are holding UNI at a low average entry price! Now would be a good time to take PARTIAL profits. Sell 25% to 50% of your holdings and keep your core positions if you were able to buy near the support zone. Don’t sell all, as there may still be some more room for this to rally short term. Watch out if it falls below the 20.00 area.
If you do not have UNI at the moment, it may be too risky to get in at this point, because it has already run up more than 100% in less than a month. Traders who got in early will be looking to cash in their profits. It would be best to wait for it to consolidate and create a proper base before entering.
- Check out our free forex signals
- Follow the top economic events on FX Leaders economic calendar
- Trade better, discover more Forex Trading Strategies
- Open a FREE Trading Account


