Will the 200 Daily SMA Offer a Buying Opportunity for Bitcoin Cash (BCH)?
Bitcoin Cash if facing the 200 daily SMA, where we expect a bullish reversal
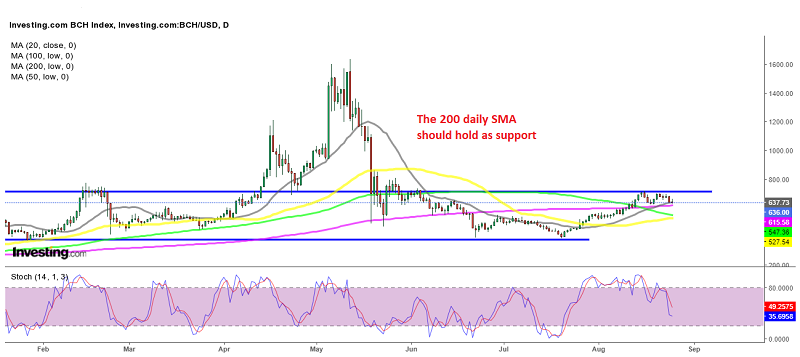
Bitcoin Cash (BCH) had a great run during the first few months of this year, having started 2021 at around $270. It had surged to $1,640 by the middle of May, with moving averages providing support for BCH and pushing the price higher.
But, the crash came and Bitcoin Cash reversed down, falling to around $470 in May. The 200 SMA (purple) was pierced, but it wasn’t broken. That moving average held as support for about a month, until the next bearish wave came in the crypto market, pushing Bitcoin Cash below that moving average, while the 20 SMA was acting as resistance.
So, the decline continued, but BCH/USD formed a bottom at around $390, which held as support until late July. The price bounced off that support zone and Bitcoin Cash turned bullish, following the rest of the crypto market higher. Moving averages were broken but buyers couldn’t push above the support/resistance area around $310.
Bitcoin Cash Live Chart
That area has rejected BCH/USD twice this month and now the price is reversing down, following the reversal in Bitcoin as well, after breaching the $50,000 level. But, sellers are facing the 20 SMA (gray) and particularly the 200 SMA on the daily chart now. The stochastic indicator is becoming oversold, which means that the pullback is going to be complete soon, while the 200 SMA should stop the pullback.
So, this looks like a good opportunity to buy Bitcoin Cash. PayPal has launched its cryptocurrency service in the UK, adding Bitcoin Cash among other coins, which should help make BCH more attractive to traders and investors. Therefore, we are following this retreat in Bitcoin Cash, attempting to go long on it. We are following the price action in Bitcoin as well, to see when the decline comes to an end in the crypto market, so we can decide about the BCH.
- Check out our free forex signals
- Follow the top economic events on FX Leaders economic calendar
- Trade better, discover more Forex Trading Strategies
- Open a FREE Trading Account