Crude Oil to Reverse Down After the US GDP and Employment Claims Reports?
Crude Oil is failing at the 20 and 100 SMAs on the daily chart after the strong bullish move this week
Crude oil has been through one of the strongest bullish momentums in a long time. In fact, this bullish run of the last three days has been the strongest since the reversal which followed the crash in crude oil in April, when US oil producers had nowhere to store the oil they produced, because the Saudis had used up all the space in the oil tanks.
Oil turned quite bearish in August, with US WTI Crude losing nearly 13 cents, but the 200 SMA (purple) provided solid support on the daily chart. Crude oil bounced off that moving average, climbing around $7, but it has now reached the 20 SMA (gray) and the 100 SMA (green).

MAs rejecting US WTI Oil today on the daily chart
The unemployment claims and the second reading of the US Q2 GDP were released a while ago, and they didn’t diverge much from the expectations. So, there’s a chance that crude oil might reverse down to the 200 SMA again, if the 20 and 100 SMAs reject the price, which is what the daily chart is showing at the moment.
US WTI Crude Oil Live Chart
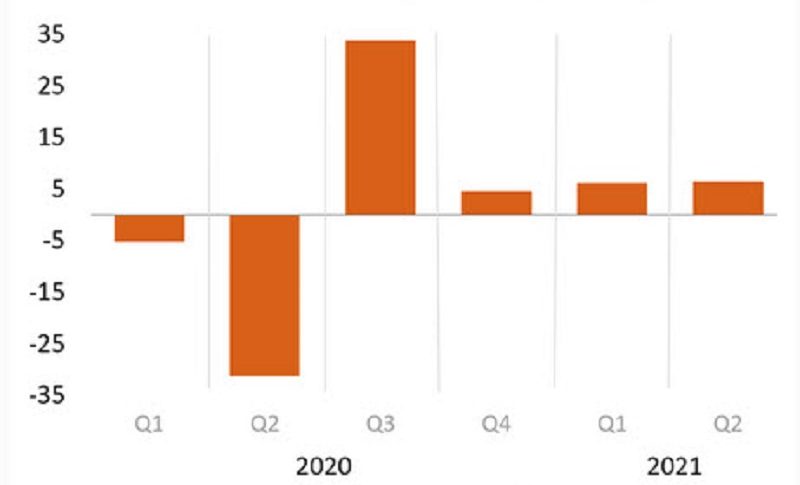
A second look at Q2 2021 GDP
- Q2 GDP (second reading) +6.6% vs +6.7% expected
- The advance reading for Q2 was 6.5%
- Q1 was 6.4% annualized
- 2020 GDP was -3.4%
- Personal consumption +11.9% vs +11.8% advance reading
- GDP price index +6.1% vs +6.1% advance
- Core PCE +6.1% vs +6.1% expected
- GDP final sales vs +7.7% advance
Details:
- Inventories cut 1.30 pp from GDP vs -1.13 pp in advanced report
- Inventories cut -2.67 pp in Q1
- Business investment 9.3% vs +8.0% advance
- Business investment in equipment +11.6% vs +13.0% advance
- Exports +6.6% vs +6.0% advance
- Imports +6.7% vs +7.8% advance
- Trade was a 0.24 pp drag vs -0.44 pp in advance report
- Home investment -11.5% vs -9.8% advance
- Consumer spending on durables +11.3% vs +9.9% advance
- Personal consumption to pp GDP vs +7.78 pp to GDP
- Government spending cut 0.33 pp vs +0.27 pp in advance report
- Full report
There were some better signs here on business investment and trade, while the consumer data was largely unchanged.
Weekly US initial jobless claims and continuing claims
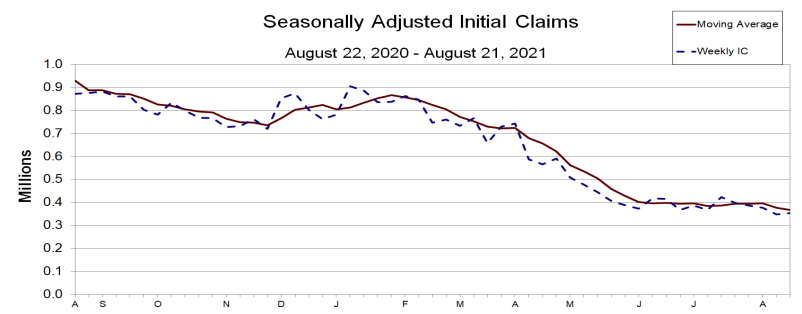
- Initial jobless claims 353K versus 345K estimate.
- Initial jobless claims four week moving average 366.5K versus 378K last week
- Continuing claims 2862K versus 2865K last week.
- Continuing claims four week moving average 2901.5 K versus 3010K last week
- For the full report CLICK HERE
- Check out our free forex signals
- Follow the top economic events on FX Leaders economic calendar
- Trade better, discover more Forex Trading Strategies
- Open a FREE Trading Account


