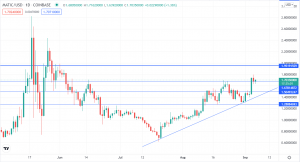
Polygon (MATIC/USD) Pauses from a Bullish Run, but Buyers are Aiming for 1.95

After posting a strong bullish run since July 21, Polygon (MATIC/USD) took a break at the 1.70 resistance. The crypto token retreated to the support of around 1.28, as it searched for another bullish move.
MATIC/USD Recap
In our previous outlook, we projected a buy on MATIC/USD after a retreat to the 1.50 or 1.28 area, while targeting take profit at 1.70 and 1.83. Prices retreated to the 1.28 area, as projected, and proceeded to reach the target profit at 1.70, trading beyond it, at 1.78.
MATIC/USD – A Technical Outlook

Polygon Daily Chart Analysis
From the daily chart above, you can see MATIC/USD towering past the 1.70 resistance. At the time of writing, it was trading at 1.708, just below the previous high of 1.79 reached on September 5. The crypto token is now consolidating at the 1.70 level, which is turning into a new support level.
MATIC/USD Recent Surge
The rise of the MATIC/USD is connected to the broader surge in altcoins in the past weeks. At the time of writing, the leading altcoins, Ethereum, Cardano and Binance Coin, were up 24.16%, 3.02% and 5.32% respectively in the past 7 days. Polygon climbed by 23.84% in the same period, although it has gone down by 3.24% in the past 24 hours.
Booming NFT and DeFi is believed to be behind the uptake of altcoins, with Polygon benefiting from the development. However, Polygon was also boosted by reports that it will form a decentralized autonomous entity for its members. The reports, which came on August 19, saw MATIC/USD surge to the 1.70 resistance.
MATIC/USD Trade Analysis
Following a break past the 1.70 resistance, which is now turning into a support area, I project that MATIC/USD will rise further. The surge is also caused by the bullish run among altcoins lately, with Polygon’s recent development also potentially supporting prices.
MATIC/USD Trade Idea
I consider MATIC/USD a buy, as long as the crypto token remains above the ascending trendline on the daily chart.
Consider these two points for buy entry trades:
1.70 – This is the immediate area below MATIC/USD’s current trading level of 1.704. The 1.70 acted as a resistance zone before, and it is becoming a support area for the current price retreat. If MATIC/USD fails to break this level to the downside, I will enter a buy trade, but I need price action trading signals to confirm the trade.
1.50 – This level has acted as a support previously, and I interpret it as a possible retreat area for MATIC/USD. If it breaches the 1.70 level, I would watch the 1.50 area as the next support to enter a buy trade.
For buy entries on MATIC/USD, I would target the 1.95 level as the take profit point. Potential upsides are possible, with targets at 2.20 and 2.40. However, I will watch key developments on Polygon and altcoins to target further upsides on MATIC/USD. Good luck!
- Check out our free forex signals
- Follow the top economic events on FX Leaders economic calendar
- Trade better, discover more Forex Trading Strategies
- Open a FREE Trading Account


