Buy Polygon (MATIC/USD) on These Points After a Breach of Resistance
After previous attempts to break past the price level at around 1.50 were muted, MATIC/USD has now found a new bullish momentum. The pair broke past this level over the weekend, surging to a high of around 1.69. However, MATIC/USD is finding it difficult to break past 1.70 and is currently consolidating. We project a slight retreat in the pair, which could open a buy opportunity.
Events that have shaped MATIC/USD
Polygon aims to enable developers to optimize applications. On its website, it claims to be “Ethereum’s Internet of Blockchains.” The crypto token delivers its promise by facilitating connections via Ethereum-compatible blockchain networks.
Recent developments on Polygon have been responsible for its continued adoption and stellar rise. On August 19, Cointelegraph reported that Polygon was aiming to form a decentralized autonomous entity for its community members. The announcement saw Polygon bounce from a low of around 1.3, to a high of 1.53 the following day. The developments have cemented Polygon as a viable project and enthusiasts can’t wait to jump in.
Let’s have a technical look at MATIC/USD trading:
MATIC/USD – A Technical Outlook

Polygon 4-Hour Chart Analysis

Polygon Daily Chart Analysis
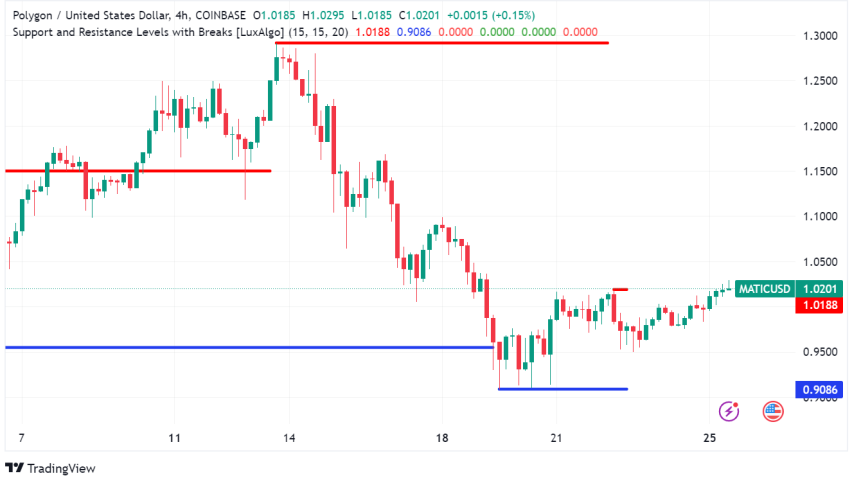
On the 4-hour chart, MATIC/USD can be seen retreating after a surge over the weekend. Observed on the daily chart, it can be seen that the 1.70 level is already established as resistance. Prices tested this area on June 21, for the last time, during the bearish run, before the downward retreat.
We can already see that MATIC/USD is finding it difficult to break past the 1.70, which makes the support the next area of focus.
Key Areas to Watch on MATIC/USD
1.50 – Observed on the four-hourly support, we can see that MATIC/USD tested this area several times before breaking past it over the weekend. We expect the recent retreat of the crypto token to be supported at 1.50, before making another bullish run.
1.28 – The area is a clear support on both the daily and 4-hourly chart. If MATIC/USD breaches past the 1.50 support, then 1.28 would be the key area of interest. Therefore, I would be keen on this level for the formation of potential price action trading signals that could open a buy opportunity in the pair.
For a buy opportunity, I would target the resistance at 1.70 as my first take profit. In the case of price surges above this level, I would see the area around 1.83 as my next take profit point. Good Luck!


