GBP/USD Holds Near 1.3550–1.3570 as US-Iran Diplomatic Hopes Ease Dollar Safe-Haven Demand
GBP/USD is trading around 1.3550 - 1.3570 on April 15th, 2026, with a bit of back and forth ( down a rough 0.05 - 0.12 % in the last few...

Quick overview
- GBP/USD is trading around 1.3550 - 1.3570, having pulled back slightly from a two-month high of 1.3590.
- The pair has gained for nearly seven consecutive days, supported by optimism surrounding US-Iran diplomatic talks.
- Technical indicators suggest strong momentum, with resistance levels around 1.3580-1.3600 and support at 1.3535-1.3540.
- Market sentiment remains cautious due to potential volatility in the Middle East and upcoming commentary from the Bank of England.
GBP/USD is trading around 1.3550 – 1.3570 on April 15th, 2026, with a bit of back and forth ( down a rough 0.05 – 0.12 % in the last few hours) . The pair has pulled back a bit from a two-month high near 1.3590 that it reached on April 14, but it’s still in the black overall, riding the coat tails of a strong multi-day rally.
This marks close to the seventh day in a row where sterling has gained ground against the dollar, pushing the pair to its highest levels since late February 2026.
Key Drivers Today
- US-Iran diplomatic optimism: The hope of resumed peace talks ( maybe a second round in Pakistan before too long) is still weighing on demand for the US dollar as a safe haven, and its keeping the pound a bit elevated. President Trump and VP JD Vance both sounded cautiously optimistic, saying that Iran ” really wants to make a deal very badly” and that they’ve actually made some real progress despite the ongoing US blockade of Iranian ports. All of this is supporting GBP/USD by undermining the dollar.
- Risk appetite’s back: As it looks like the tensions are easing ( even if the fragile truce and the fact that the US is still blocking Iranian ports are still pretty unstable ) it’s making investors feel a bit more comfortable moving into riskier assets, which is boosting the pound.
- BoE commentary in focus: Later today, Bank of England Governor Andrew Bailey is giving a speech, and it will be interesting to see if anything he says gives us any more insight into possible interest rate moves in the UK amid lingering worries about high energy prices.
Technical Outlook
GBP/USD has shown some really strong momentum lately, breaking above a key pair of moving averages and pushing towards resistance around 1.3580-1.3600. If it can stay above this level, then 1.3650 or higher could be on the cards. However, the pair is now trading in a fairly narrow channel just above 1.3550, with immediate support at 1.3535-1.3540 and stronger support at 1.3500. That said, some overbought signals ( e.g. the RSI getting up to 70 on some shorter timeframes) are suggesting that a bit of caution is in order.
Broader Context
The pound has been doing better in recent days, mainly because the dollar’s lost a bit of strength. However, the situation in the Middle East is still pretty volatile. If there’s any breakdown in US-Iran talks or if things heat up again, then the gains could be quickly reversed and the USD could get stronger. April’s traditionally a good month for GBP/USD, on average, but all the same, things are still pretty uncertain.
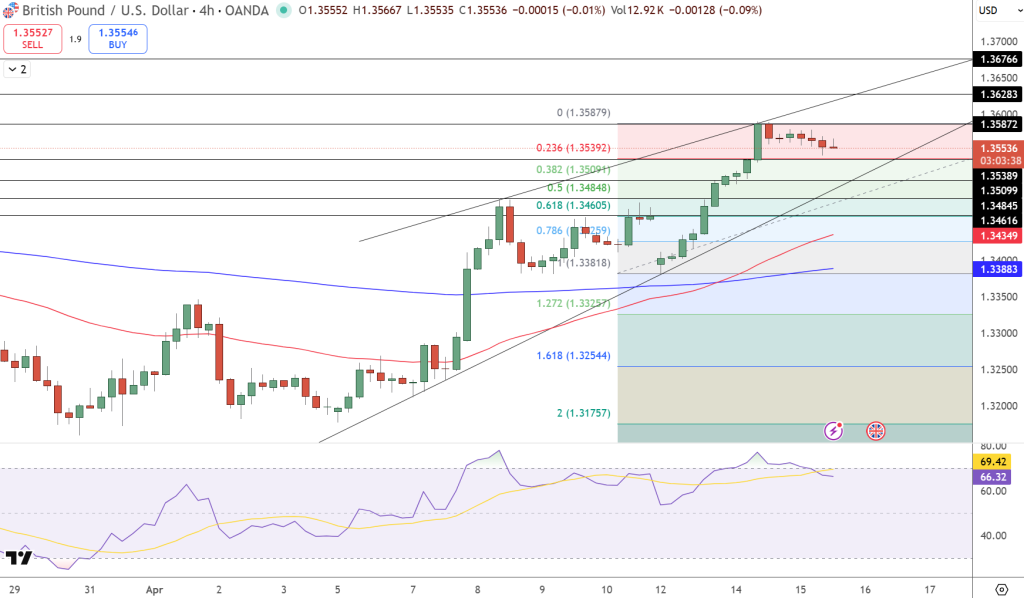
GBP/USD on the 4 hour chart is showing a bit of a pullback after getting rejected at the resistance zone around 1.3580-1.3600, but the overall bullish picture is still holding up. Price is still trading inside an ascending channel, with higher lows being supported by the rising trendline.
The 50 day EMA is still trending upwards and is acting as dynamic support, and the 200 day EMA is sitting nicely below that one, reinforcing the underlying uptrend. The fact that price has pulled back below resistance is probably a case of people taking some of their profits out, rather than a change in the overall mood.
Fibonacci levels are showing that the pair has stayed above the 0.382-0.5 retracement zone, which suggests that buyers are still keen on stepping in on any dips. The RSI is easing down from overbought territory, but is still above 60, which means momentum’s still pretty high.
Key Levels
- Resistance: 1.3580 → 1.3620 → 1.3670
- Support: 1.3535 → 1.3500 → 1.3450
Trade Idea: If you can buy above 1.3580 and aim for 1.3670, and make sure to have a stop below 1.3500.
- Check out our free forex signals
- Follow the top economic events on FX Leaders economic calendar
- Trade better, discover more Forex Trading Strategies
- Open a FREE Trading Account
- Read our latest reviews on: Avatrade, Exness, HFM and XM
Related Articles
Sidebar rates
Related Posts
