Uniswap (UNI): Exploding soon?
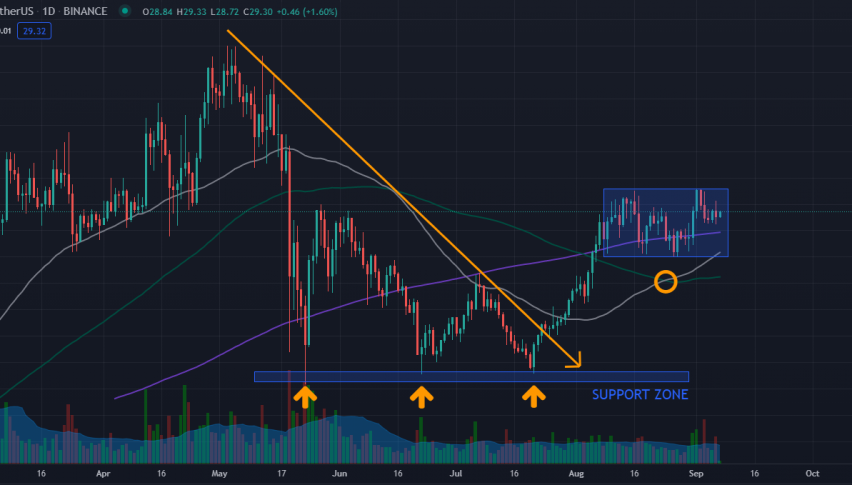
*UNI daily chart: Holding well above the 200-day moving average
This is a follow-up to an earlier article on UNI on August 20, 2021: Uniswap (UNI): Potential Golden Cross Soon?
Previously, I hinted that UNI would form a 50-day moving average (gray line) to a 100-day moving average (green line) golden cross, which actually did happen a few days after writing about it (see encircled in gold above). Now, the next thing we would like to see from UNI is a 50-day to 200-day (purple line) moving average golden cross.
The bullish case for UNI has been growing stronger and stronger as time passes. Just a recap, here is a summary of the confluence of bullish signals for UNI:
-
- Triple-bottom pattern (see three golden arrows) – formed at the support zone of UNI. A triple-bottom pattern is a bullish chart pattern that shows where buying demand strengthens and where selling supply weakens. This is usually followed by a breakout of an immediate resistance level. In the case of UNI, it broke several resistance level,s as will be discussed further below.
- Downtrend line broken – UNI’s downtrend (see golden line pointing downwards) was broken late July 2021 at 17.50, as it bounced above the third-triple bottom.
- A rally above a whole number and a major psychological resistance level for most traders: 20.00.
- A rally above the 200-day moving average – this long-term moving average is a key indicator of strength. It would seem that the overall health of UNI has drastically improved.
- Mini Golden Cross: 50-day to the 100-day moving average
- 200-day MA Resistance turned Support level: After UNI rallied above the long-term moving average, it retested it at least three times. It bounced above the moving average all three times confirming that it has now turned into a support level.
However, despite all the bullish confluences for UNI. It is now currently sitting at the 50.00% Fibonacci retracement level which means the bulls and bears are now at an impasse. UNI is in the exact middle of its highs and its lows. The risk to reward ratio, if you were to take a position in UNI now, would be 1 to 1. As such, it is no use doing anything right now. It would be best to wait and see how UNI reacts in the following days.
Looking forward, here are some things to look out for, for UNI to sustain this bullish sentiment:
-
- Major Golden Cross: 50-day to the 200-day moving average crossover.
- UNI should hold above the 200-day moving average line as it is doing now.
- A breakout above the current consolidation at 31.50 with volume.
Trade Idea: A breakout of its current consolidation
Buy: 31.50 – 32.00
Stop Loss: 25.00 (low of the consolidation and a breakdown of the 200-day MA)
Target Price:
Short-term: 34.00-35.00 (61.80% Fib. retracement level)
Mid-term: 38.00-40.00 (78.60% Fib. retracement level and psychological whole number)
Long-term: 45.00 (All-time high)
VAR: 1.00 only
Remember to always manage your risk!
- Check out our free forex signals
- Follow the top economic events on FX Leaders economic calendar
- Trade better, discover more Forex Trading Strategies
- Open a FREE Trading Account
- Read our latest reviews on: Avatrade, Exness, HFM and XM
Related Articles


Sidebar rates
Related Posts
