Dogecoin and Shiba Inu Coin Analysis – Signs of Life in SHIB/USD as Meme Coins Hold
The 200 daily SMA keeping Dogecoin bullish, while Shiba Inu coin made a strong bounce yesterday
Meme coins proved once again this week, that they are much softer than most of the crypto market, after they lost around 35% of their value during the crash on Tuesday, while most of the cryptocurrencies declined less than 30%. That came on top of meme coins finding it difficult to resume the bullish trend in the last few weeks, while the rest of the crypto market was surging higher. But we have been seeing some signs of life in the meme coins in the last two days.
Shiba Inu Coin Analysis – SHIB/USD Remains Within the Range

Shiba Inu bounced 60% yesterday, as range trading continues
Shiba Inu coin was feeling really bearish earlier this week, as it fell from $0.0000075 (5 zeros) to $0.0000050 on Tuesday, and sellers pushed the price below the lower level of the range, where it had been trading for more than three months. That is another bearish sign for SHIB/USD, as all other cryptos have resumed the uptrend, but not this one.
The support level of the range came at around $0.0000058, which was pierced, as the crypto crash sent Shiba Inu tumbling lower. Although, the first positive sign for this crypto was the fact that it pulled back up after falling to $0.0000050, and closed the day above the support level on Tuesday.
Shiba Inu Coin Live Chart
So, the range was not officially broken and the area around $0.0000050 offered strong buying interest on Tuesday. Yesterday we witnessed some buying pressure again in Shiba Inu coin, after the jump to $0.0000082, which means a 60% increase from Tuesday’s low. We were planning on buying SHIB/USD, but the jump was too fast and we missed it. So, the range-bound price action continues, but at least there are buyers.
Dogecoin Analysis – DOGE/USD Forming A Bullish Reversing Pattern

The 200 SMA still holds as support for Dogecoin
Dogecoin was being pushed down by the 20 SMA (gray) on the daily chart during the bearish period in the crypto market, which started in May. But it found support at the 200 SMA (purple) in July and reversed higher, unlike Shiba Inu which continues to trade in a range.
Dogecoin increased from $0.16 to $0.35, but this week, we saw a rapid downward crash. However, the 200 SMA came to the rescue once again and stopped the crash on Tuesday. Yesterday’s candlestick closed as a doji, which is a bullish reversing signal after the decline, so the daily chart setup points higher. Buying Dogecoin at the 200 SMA, at around $0.22, would have been great, but going long here is not a bad idea either, since there’s a lot of room to the upside for this meme coin.
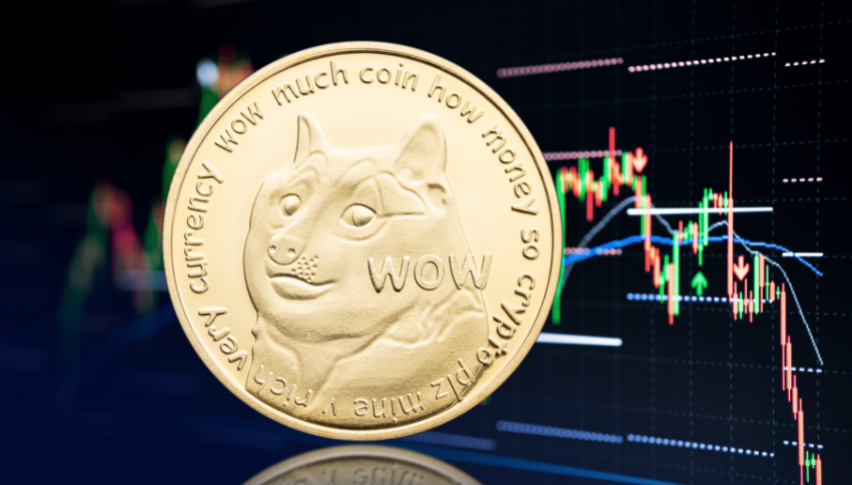
Dogecoin Live Chart
- Check out our free forex signals
- Follow the top economic events on FX Leaders economic calendar
- Trade better, discover more Forex Trading Strategies
- Open a FREE Trading Account
- Read our latest reviews on: Avatrade, Exness, HFM and XM
Related Articles


Sidebar rates
Related Posts
