What Are Economists Expectations About the FED Meeting Next Week – Will They Tapper?
Next week is FED meeting week, which means that we’re going to hear plenty about tapering. I tend to file it all under ‘noise’. At this point, the Fed debate revolves around announcing a taper in November or December, but the difference is negligible.
The other argument is the size and the pace of the taper. The parameters on that are revolving around a six-month, eight-month, or twelve-month timeline to halt purchases. I’d also argue that this doesn’t really matter either, particularly since the Fed is now going to great lengths to disassociate tapering with liftoff. I think the markets have realized their message.
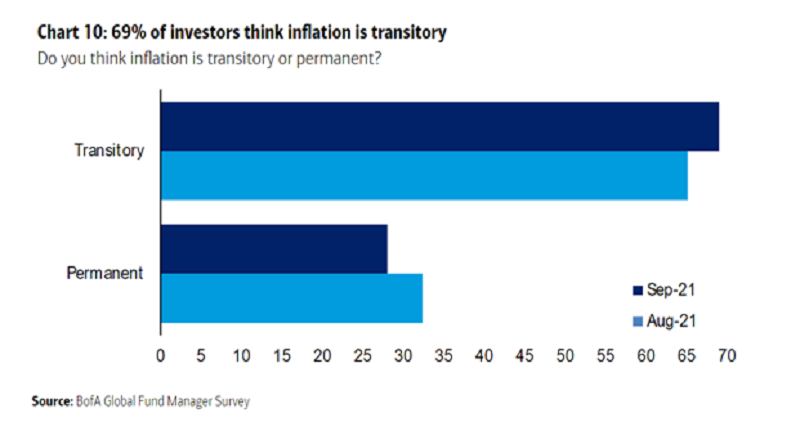
So if we zoom out, the only real thing that matters is the date of liftoff and that’s a circular argument back to inflation. Lately, the side which thinks that inflation is transitory is winning, as shown by the BofA hedge fund manager survey on the image above.
Will that continue?
It depends on the data. This week CPI numbers were low and that will give the Fed a bit more confidence in staying patient. But what the future holds is highly uncertain and I think that’s why markets continue to bob around.
Highlights of the US August 2021 CPI report

- Prior was +5.4%
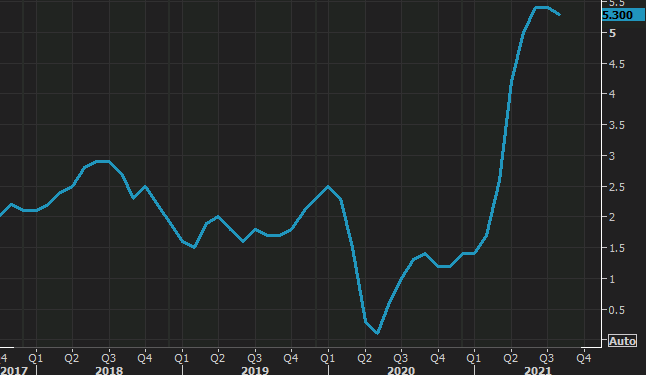
- August CPI +5.3% y/y vs +5.3% expected
- CPI MoM +0.3% vs +0.4% expected
- Prior m/m reading was +0.5%
- Real weekly earnings +0.3% vs -0.1% expected
- Full release (pdf)
- Core CPI YoY excluding food and energy +4.0% vs +4.2% expected
- July core CPI was +4.3%
- Core CPI MoM +0.1% vs +0.3% expected — lowest since February
- July core CPI MoM +0.3%
These numbers are broadly lower than anticipated and the US dollar is down across the board in response by around 20 pips. The year-over-year chart (above) is starting to look like a covid case count chart that’s beginning to roll over. That’s exactly what the Fed is looking for via its ‘transitory’ narrative.
- Used cars MoM -1.5% vs +0.2% prior
- Used cars YoY +31.9%
- New vehicles MoM +1.2% vs +1.7% prior
- New vehicles YoY +7.6%
- Shelter MoM +0.2% vs +0.4% prior (this skews a bit lower because of falling hotel prices)
- Energy +2.0% MoM vs +1.6% m/m prior
- Energy +25% YoY
- Food +0.4% MoM vs +0.7% prior
- Airline fares -9.1% MoM
More at the top of mind is how demand will develop as bottlenecks crimp supply and push up pricing. Today’s UMich sentiment survey showed terrible buying intentions for durable goods, cars and houses.
Globally is where the largest worries lie. The eyes of all veteran market participants gloss over the idea of a China crisis or pronounced slowdown because we’ve been hearing it for 20 years but Evergrande and common prosperity is something new. So while we’re all focused on the FOMC next week, it may be the PBOC that steals the show.


