Buying USD/CAD As Retail Sales Decline in Canada
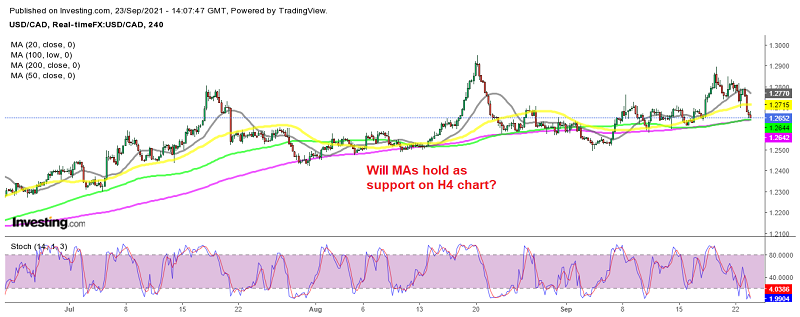
USD/CAD has retraced down, but it is finding support at MA, where we decided to go long

USD/CAD turned bullish at the beginning of June and although the latest high is lower than the previous one, the lows keep getting higher, with moving averages acting as support for this pair. We decided to buy this latest pullback right at moving averages with the 100 SMA (green) and the 200 SMA (purple) standing just below. The retail sales data from Canada was better than expected, but it still was a decline in July.
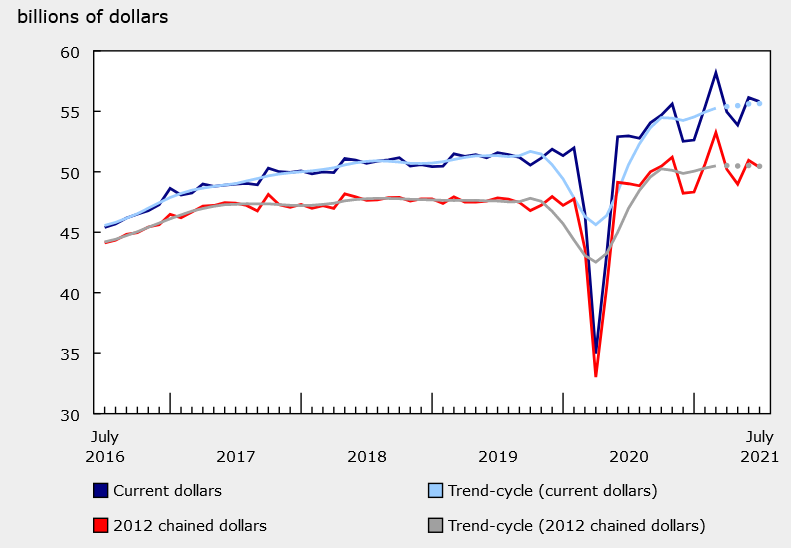
Canada July 2021 Retail Sales

- July retail sales -0.6% vs -1.2% expected
- Juna sales were +4.2%
- Prelim July estimate was -1.7%
- Sales ex-autos and gas -1.3%
- Core sales ex autos -1.0% vs -1.5% expected
- Flash estimate for August +2.1%
- Sales down in 5 of 11 subsectors
- Full report
Food and beverage stores (-3.4%) are mostly grocery stores and fell as restaurants opened while building material and garden equipment and supplies dealers (-7.3%) fell as lumber prices peaked and people pulled back on renos. E-commerce sales fell 19.5%.
On the upside, people starting buying clothes along with the reopening as that category rose 7.6%. Canadian auto inventories haven’t had quite the crunch as in the US (at least they hadn’t yet in July) and sales rose 0.4% led by new vehicles.
Overall, this is a decent report, though I might have hoped for more in the preliminary August data. The Canadian dollar is fractionally higher on the report.
Here’s what CIBC had to say about the report:
Canadians seem to have been spending much more money overall this summer than last. That reinforces our view that household spending growth will drive the economy in Q3. Still, the savings rate will likely remain elevated relative to pre-pandemic trends leaving ample room to drive future spending. The concern now is whether the Delta variant will force another round of public health restrictions across the country that limit the ability of Canadians to go out and make purchases
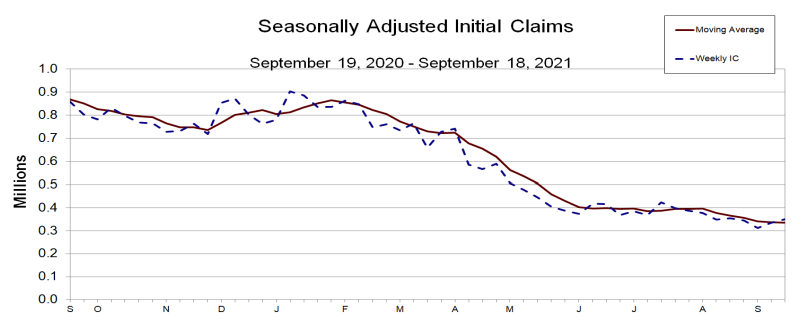
On the other hand, US unemployment claims came higher than expected, but the overall trend continues to decline and soon they will head below $300K. So, we decided to go long on USD/CAD above moving averages on the H4 chart.
US initial jobs claims and continuing claims

- Prior week 332K revised to 335K
- Initial jobs claims 351K versus 320K estimate four week moving average
- four week moving average 335.75K
- continuing claims 2.845M vs 2.65M estimate
- prior week was revised to 2.714M vs 2.665M previous
- four week moving average 2.804M vs 2.819.75M
- The largest increases in initial claims for the week ending September 11 were in Louisiana (+4,318), District of Columbia (+3,783), Arizona (+3,739), Maryland (+2,018), and Missouri (+1,658),
- The largest decreases were in Illinois (-7,481), California (-5,950), Ohio (-4,665), Texas (-3,635), and Virginia (-2,357).
The report coincides with the BLS jobs report survey for the next US job report. If that is the case this report suggests a so so employment report. However, Fed’s Powell said that he is not looking for stellar jobs report just advancing ones, suggesting it is full steam ahead regardless of the ebbs and flows in the jobs reports going forward.
- Check out our free forex signals
- Follow the top economic events on FX Leaders economic calendar
- Trade better, discover more Forex Trading Strategies
- Open a FREE Trading Account


