Litecoin Price Prediction – Downward Trendline to Drive Selling at $146
The LTC/USD closed at $145.000 after reaching a high of $154.900 and a low of $145.000. LT/USD continued its bearish streak for the fourth
Written by:
Arslan Butt
•
Wednesday, September 29, 2021
•
2 min read
•
Last updated: Wednesday, September 29, 2021
The LTC/USD closed at $145.000, after reaching a high of $154.900, and a low of $145.000. LTC/USD continued its bearish streak for the fourth consecutive session, amid the prevailing negative market sentiment and the strength of the US dollar.
The recent announcement from the People’s Bank of China, banning all services related to cryptocurrencies, including trading in crypto derivatives, put additional pressure on the whole cryptocurrency market. Along with all major coins, the leading currency faced pressure and declined, turning the entire market mood negative.
The Chinese government has already revealed its plans to shut down all mining activities related to digital assets. Given the crackdown, the second largest
Ethereum mining company, Sparkpool, has also announced that it will close its local and international operations on September 30. The cryptocurrency exchanges will not even allow their clients to trade in crypto derivatives now. This news boosted the downside pressure on
BTC/USD, dragging the whole market sentiment with it, resulting in a decline in LTC/USD.Furthermore, the US dollar rose on Monday, with the US Dollar Index reaching 93.49, and the benchmark US Treasury Yield surging to 1.51%. The optimistic comments by various Fed officials on Monday, including Lael Brainard, John Williams and Charles Evans, supported the increase in the price of the US dollar.
The greenback gained further strength because all of the officials backed the statement that inflation and employment goals were moving towards substantial further progress, that would result in a reduction in asset purchases by the central bank. The strength of the US dollar weighed on the LTC/USD pair, dragging its prices further to the downside, as the two are negatively correlated.

Litecoin Price Prediction – Technical Outlook – Downward Trendline Resistance at $146
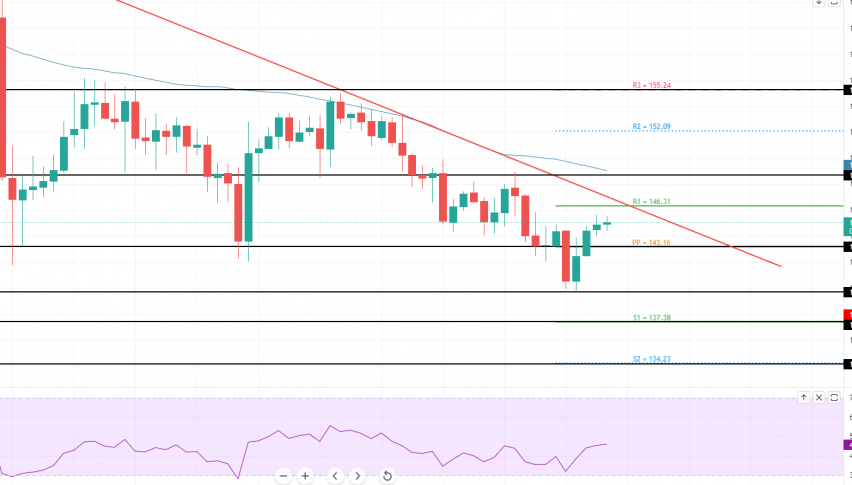
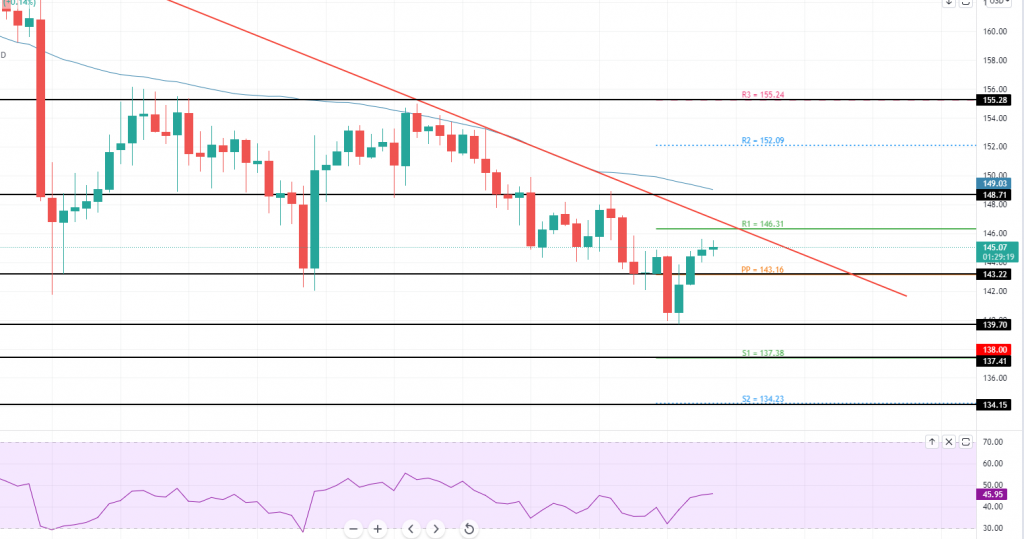
The LTC/USD pair is trading with a bearish bias at 145.19, facing immediate resistance at 146.31. Closing of candles below 146 supports the chances of a selling trend in the LTC/USD pair.
On the lower side, the LTC/USD pair may find immediate support at the 143.16 level, and a bearish breakout at this level would open up additional room for selling, until 139.70 and 134.23.
On the higher side, the downward trendline is extending resistance at the 146.31 level. Thus, a bullish breakout at the 146 level would expose the pair to to resistance levels at 148 and 152. Further towards the upside, the 50 periods SMA (simple moving average) extends resistance at the 155 level. Let’s keep an eye on the 146 level below this, where the LTC/USD may exhibit a selling trend and vice versa. Good luck!
Arslan Butt
Lead Markets Analyst – Multi-Asset (FX, Commodities, Crypto)
Arslan Butt serves as the Lead Commodities and Indices Analyst, bringing a wealth of expertise to the field. With an MBA in Behavioral Finance and active progress towards a Ph.D., Arslan possesses a deep understanding of market dynamics.
His professional journey includes a significant role as a senior analyst at a leading brokerage firm, complementing his extensive experience as a market analyst and day trader. Adept in educating others, Arslan has a commendable track record as an instructor and public speaker.
His incisive analyses, particularly within the realms of cryptocurrency and forex markets, are showcased across esteemed financial publications such as ForexCrunch, InsideBitcoins, and EconomyWatch, solidifying his reputation in the financial community.
Related Articles