Solana (SOL) Showing Strength as it Gains 50+% in Two Weeks
*SOL Weekly Chart shows a rebound of 53% from lows of 116 weeks ago
Explosive recovery for SOL
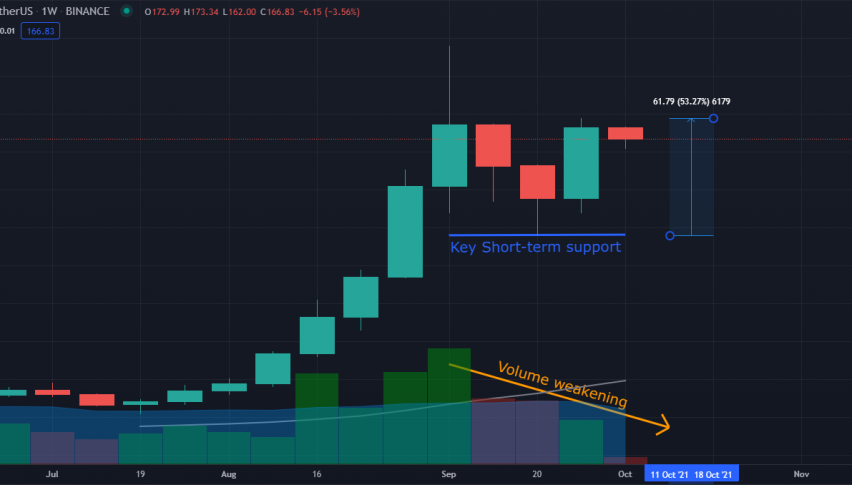
Solana (SOL) recorded its first green week after two consecutive weeks of corrections. Since then, it has bounced back impressively from the 116.00 lows of September 21, to reach a high of 177.79 three days ago – a huge 53% gain in just a couple of weeks.
I reiterated last week that we needed more information before entering into a SOL position. Here is a recap of previous observations, as the price reached key support levels during the two red weeks SOL had.
| Support Levels | Price | Description | Initial Observations |
| 1 | 169-170 | 10-day MA, 23.60% Fib. | Broke down, retested once and failed. Could be a key resistance area in the future |
| 2 | 140 | est. 20-day MA, 38.20% Fib. | Currently hovering at this level. |
| 3 | 120 | 50% Fib. retracement level | Undercut this level but immediately recovered, strongly suggesting that this is a strong support area. |
| 4 | 100 | Whole Number, 61.80% Fib | N/A |
Strong support at levels of 116 – 120
Due to the recent bullish price action we have seen in SOL, it would indeed suggest that Support Level 3 or the price of 120.00 is a key area where there is a lot of buying demand. Traders who were able to get in in this area are most likely to take some profits off the table due to the quick run-up in price in a short space of time. We will probably see a consolidation for SOL over the next days or weeks.
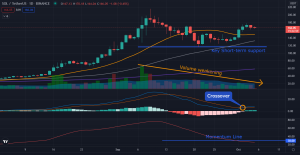
*SOL Daily Timeframe – indicators suggest a consolidation
Most probable situation: Consolidation or range trading
Solana’s daily chart indicators suggest the same sentiment of consolidation or range trading from Support Level 3:116-120 to Resistance levels: 200-220.
-
- SOL experienced a slow decrease in trading volume day-on-day during the 2-week correction period, which means the selling supply slowly dwindled until it finally reached the key support level.
- This is reinforced by a bullish MACD crossover that appeared recently, which confirms that the strong correction experienced 2 to 3 weeks ago has weakened, and the bulls may have finally come into play.
- SOL’s Average Directional Index (ADX) is below the 30.00 momentum line, which suggests there is not much momentum in the market. (Note: The last time SOL reached an ADX of 30 was in August of this year. It then rallied to a high of 216.00, which was a 385% gain from the time it reached this momentum line.)
SOL may have bounced strongly above the 120 support level, but it is most likely that a consolidation is in order before it rallies to all-time high levels again late this year. Of course, anything can happen in the markets. A V-shaped recovery could occur, because of the major fundamental catalysts for Solana, but so far, the technical price action and indicators suggest otherwise.
- Check out our free forex signals
- Follow the top economic events on FX Leaders economic calendar
- Trade better, discover more Forex Trading Strategies
- Open a FREE Trading Account
- Read our latest reviews on: Avatrade, Exness, HFM and XM
Related Articles


Sidebar rates
Related Posts
