Gold price forecast: Is It Worth Placing a Buy Limit at $1,749?
Gold prices were closed at $1759.85 after reaching a high of $1768.95 and a low of $1749.20. After rising for three consecutive sessions
Written by:
Arslan Butt
•
Wednesday, October 6, 2021
•
3 min read
•
Last updated: Wednesday, October 6, 2021
- Gold prices closed at $1,759.85, after reaching a high of $1,768.95, and a low of $1,749.20.
- US Dollar Index, which measures the greenback’s value against a basket of six major currencies, rose to 94.07.
- The trade balance for August showed a deficit of -73.3B against the projected -70.5B, thus weighing on the US dollar.
The GOLD prices closed at $1,759.85, after reaching a high of $1,768.95, and a low of $1,749.20. After rising for three consecutive sessions, gold dropped on Tuesday, amid the comeback of the US dollar, after investors started finding refuge in the greenback, after a selloff in the stock market, that was driven by concerns over soaring energy prices.
The US Dollar Index, which measures the valu of the greenback against a basket of six major currencies, rose to 94.07 on Tuesday, after fears accelerated in the market, relating to rising oil prices. This, in turn, could add to the existing inflationary pressures. The 10-year US Treasury Yields also surged, rising to 1.50%, which added strength to the greenback and ultimately dragged the yellow metal to the downside.
It was another frustrating trading day for the gold market, as investors were more focused on short-term developments, like the gains in the greenback and Treasury Yields, while ignoring the unfolding energy crisis that is driving a negative growth narrative. On Tuesday, the US stock market saw a massive selloff, amid concerns about rising inflation, the energy crisis, fragile US -China trade ties, China’s Evergrande debt crisis and a stalemate over the US debt ceiling.
All the above-mentioned factors combined and dampened the risk appetite for equities, which prompted investors to find shelter in the US dollar. The rising prices of the greenback then weighed on the precious metal.
Review of Economic Events
On the data front, at 17:30 GMT, the Trade Balance for August was released, showing a deficit of -73.3B against the forecast of -70.5B, which weighed on the US dollar. At 18:45 GMT, the Final Services PMI for September came in, showing a surge to 54.9, against the projected 54.4, which supported the US dollar, putting further downside pressure on the gold price.
According to the data released at 18:54 GMT, October’s IBD/TIPP Economic Optimism dropped to 46.8, against the estimated 51.3, which impacted negatively on the US dollar. At 19:00 GMT, the ISM Services PMI for September came in, indicating a surge to 61.9, against the predicted 59.9, which bolstered the greenback and put further downward pressure on gold.
Furthermore, investor focus was also on the US non-farm payrolls data that is scheduled for Friday. It is expected to show continued improvement in the labor market, which could prompt the US Federal Reserve into starting to taper its monetary stimulus before the end of the year.
Furthermore, Federal Reserve Vice Chairman Randal Quarles said on Tuesday that US lenders and corporate borrowers need to speed up the pace of their switch from LIBOR to new reference rates. He also stated that after December 31, LIBOR might not be used in new financial contracts.
Gold price forecast: Is It Worth Placing a Buy Limit at $1,749?
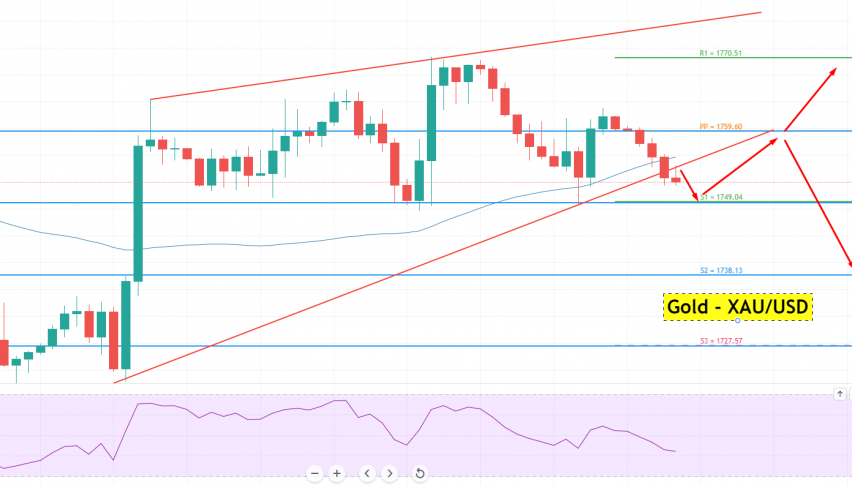
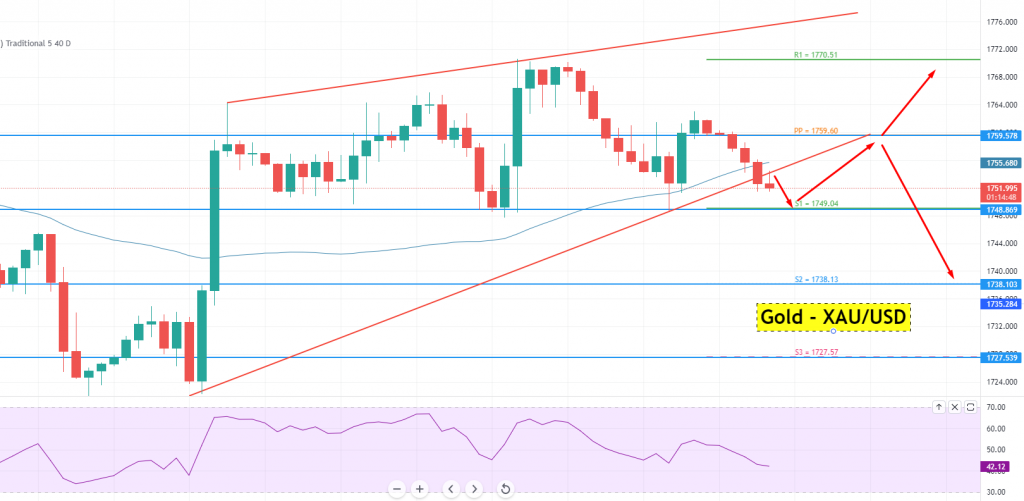
Gold was trading at $1,756 per ounce on Tuesday, with a bearish bias. It is currently receiving immediate support at the 1,754 mark, which has been prolonged by an intraday pivot point. Gold has breached the pivot point support mark of 1,762, exposing it to the 1,754 support level.

Daily Technical Levels
Support Resistance
1,749.71 1,769.46
1,739.58 1,779.08
1,729.96 1,789.21
Pivot Point: 1,759.33
On the downside, a breakthrough at the 1,754 level would open the precious metal to levels of 1,747 and 1,739. A break at 1,739 would expose gold to the 1,731 level. On a positive note, the next resistance level for
GOLD remains at 1,762, and a break at this level would open the precious metal up to the 1,770 level. The
RSI and stochastic both support a selling trend in
GOLD; therefore, a bearish bias prevails below 1,762 and vice versa.
Arslan Butt
Lead Markets Analyst – Multi-Asset (FX, Commodities, Crypto)
Arslan Butt serves as the Lead Commodities and Indices Analyst, bringing a wealth of expertise to the field. With an MBA in Behavioral Finance and active progress towards a Ph.D., Arslan possesses a deep understanding of market dynamics.
His professional journey includes a significant role as a senior analyst at a leading brokerage firm, complementing his extensive experience as a market analyst and day trader. Adept in educating others, Arslan has a commendable track record as an instructor and public speaker.
His incisive analyses, particularly within the realms of cryptocurrency and forex markets, are showcased across esteemed financial publications such as ForexCrunch, InsideBitcoins, and EconomyWatch, solidifying his reputation in the financial community.
Related Articles