Aave Surge Looks Sustainable, Polkadot Heading for Previous ATH?

It’s a fresh new week, and most crypto tokens are looking up. Bitcoin has already hit a new record high, while its closest rival, Ethereum, is close to its previous ATH.
But the crypto tokens that are really attracting our attention are Aave (AAVE/USD) and Polkadot (DOT/USD).
AAVE/USD has Broken a Barrier and is Eyeing Higher Levels
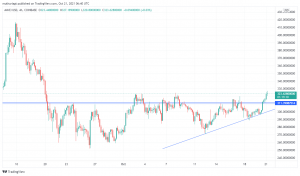
AAVE/USD was subdued below 311.4, which acted as resistance in the past month. However, following the renewed bullish strength, which started on October 20, AAVE/USE rose past the resistance and now looks set to go higher.
At the time of writing, AAVE was trading at 324.63, with level 311.4 acting as support. The crypto token has gone up by 9.59% in the past 24 hours, taking the total gains for the week to 9.61%.
– A 4-Hour Technical Outlook

From the 4-hour chart above, we can see that AAVE/USD is towering above the support at 311.4 and looking increasingly bullish. Previously, prices were contained in an ascending triangle, in a higher-highs and higher-lows momentum. With AAVE/USD having breached 311.4, we project higher prices. But, should you buy it?
AAVE/USD Could Face a Hurdle at 324, but Only Temporarily
AAVE/USD is already trading at the 324 level, and we see a potential minor resistance or correction before it resumes the uptrend. Although we do not consider the level to be a resistance zone, prices have retreated at this level twice, on October 3 and 8. This means that AAVE/USD could again face some short-term downward pressure. However, this is only speculative, based on previous price action, and AAVE/USD could ride on the bullish sentiment in crypto to maintain its surge.
AAVE/USD Trade Idea
We recommend a buy on AAVE/USD, based on the current price action and crypto sentiment. Nonetheless, we urge patience until the price breaks past 324 sufficiently, before entering a buy trade.
If prices drop after hitting 324, we would consider buying at the 311.4 support, upon confirmation via price action, or on a strong bullish sentiment. Our targets would be at 346, 372, or even higher, up to 415.
DOT/USD Surge Far from Over – ATH Next?
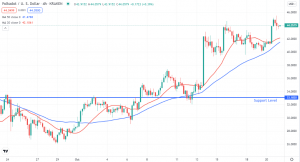
Polkadot (DOT/USD) has remained bullish since the beginning of the month. The pair began its upward momentum at $26 on September 30. At the time of writing, DOT/USD was trading at $43.8, at a minor correction, and looking to go higher. Can DOT/USD claim its previous high of $48 or set a new one?
Important Developments – Two recent developments could be behind the bullish sentiment in DOT/USD. The first is the recent unveiling of a $770 million development fund meant to enhance the blockchain ecosystem. Another event that could potentially support higher prices is the upcoming Polkadot parachain auctions, set to begin on November 11.
Well, let us have a look at the technical analysis.
– A 4-Hour Technical Outlook

Looking at the 4-hour chart above, DOT/USD is currently making higher highs and higher lows. It is getting support from the 50 MAs (blue line) and the 20 MAs (red line). The prices have bounced off the 50 moving average three times this month, giving it some significance to the upside.
Another key visible level is the short-term support at $40 which the prices tested on October 19. Prices are currently on a slight retrace, but still above the 50 and 20 moving averages, which confirms that the bull run is far from over.
DOT/USD-Trade Idea
Although I maintain a bullish view of DOT/USD, I recommend that we wait for the prices to retrace to the 50 MA and only enter with the confluence of a bullish price action signal or sentiment.
If prices were to reverse and move towards the support level, I would wait to buy at $40, or alternatively, at the long-term support of $33. But with the fundamental and technical analysis aligning, I see DOT/USD surging towards the previous highs. Happy trading!
- Check out our free forex signals
- Follow the top economic events on FX Leaders economic calendar
- Trade better, discover more Forex Trading Strategies
- Open a FREE Trading Account


