Avalanche (AVAX), Polkadot (DOT), Terra (LUNA) Coins Prepare for New AT Highs
Avalanche, Polkadot and Terra Luna are all moving higher as the sentiment remains positive in the crypto market

Despite some cryptocurrencies that are stagnating, the sentiment in the crypto market has remained bullish in October, especially in the second half. Bitcoin made new all-time highs (ATH) at $67,000, while the rest of the market joined in later on, and some cryptos are looking to break above the recent highs.
Avalanche Daily Chart Analysis

The 50 SMA held as support for AVAX/USD
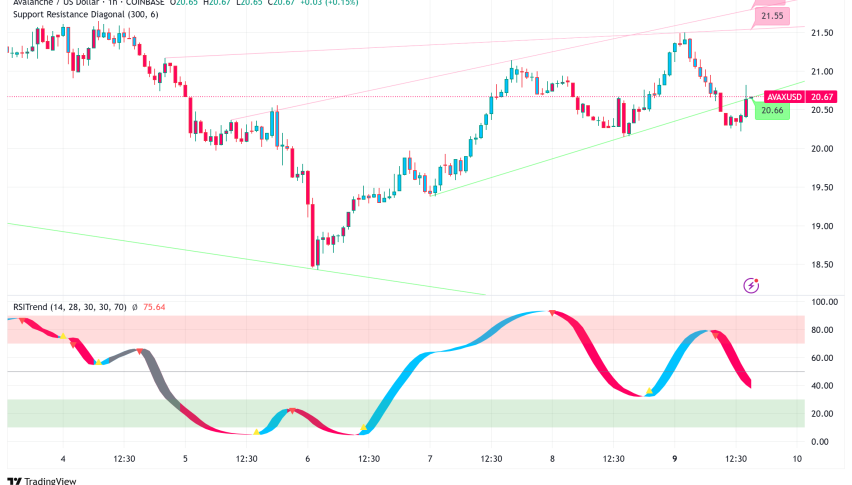
As shown on the daily chart above, Avalanche had its first strong bullish run in February, and it has been retreating since then. The second bullish leg in August ended around the same area, below $60, which turned into a resistance zone for AVAX/USD, which now seems to have turned into support.
In September, we saw another strong bullish rally, despite the bearish sentiment in the crypto market, showing Avalanche’s resilience once again. The new high came at almost $80, but during the first two weeks of October, we saw another pullback lower. The 50 SMA (yellow) held as support for this cryptocurrency, and the price bounced off of it. It is now trading at around $70, and heading for new highs.
Polkadot Daily Chart Analysis

DOT/USD trading in the bullish zone
Polkadot has also seen some strong buying pressure since July, although it hasn’t been able to place new highs since May. It climbed up from the bearish zone in August, while during September Polkadot traded in a range, with the 200 SMA (purple) and the 50 SMA (yellow) acting as support.
Now, the price is trading in the bullish zone, after making a break higher this month. Moving averages haven’t caught up with the price yet, so once they do, the bullish trend for DOT/USD will probably resume again. The previous high at $40 will probably turn into support as well now, which would be a good place to buy Polkadot on a retreat lower.
Terra LUNA Daily Chart Analysis

Buyers remain in control of LUNA/USD
Terra LUNA placed a high in March this year, at around $22, while forming a base around $4-$5 after the crash in May. The trend reversed for LUNA/USD in July, and picked up considerable speed in August, leaving behind all moving averages. In the last two months, the trend has slowed, but it keeps progressing, with both highs and lows moving higher.
During September, we saw two strong selloffs, but the high of $22 in March turned into support. In October, the 50 SMA (yellow) has taken over that job, and it is pushing the lows higher. Now the target is the high from earlier this month, just below $50, which will probably be taken out soon, as Bitcoin progresses higher.
- Check out our free forex signals
- Follow the top economic events on FX Leaders economic calendar
- Trade better, discover more Forex Trading Strategies
- Open a FREE Trading Account