Ethereum (ETH), Cardano (ADA), Solana (SOL) Crypto Price Prediction
Ethereum and Solana look tempting to buy, while Cardano (ADA) looks undecided
Last week was sort of boring for cryptocurrencies, but this week they have turned interesting again. In the first half of the week, the upside momentum picked up incredible pace across the market but yesterday we saw a sharp pullback after some profit-taking, following the surge.
But the decline stalled and now cryptos are trying to decide whether to resume the bullish trend. So, they are presenting us with some good buying opportunities right now and we will have a look at Ethereum, Cardano and Solana here.
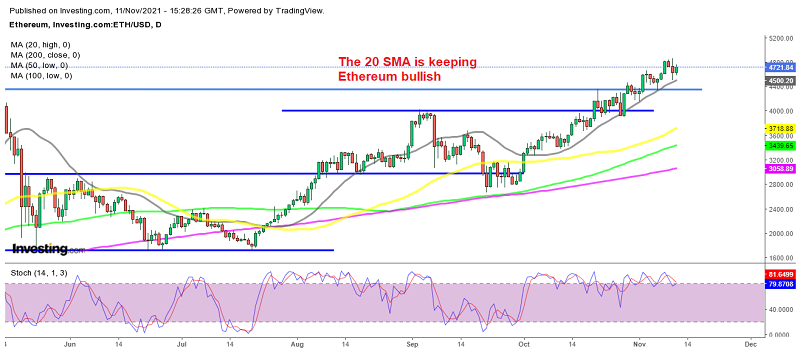
Ethereum Daily Chart Analysis – The 20 SMA Holds the Uptrend
Ethereum has been even more bullish than Bitcoin since July. It increased from around $1,700 to above $4,000 in August but couldn’t hold above there for too long. We saw a retreat in September but the bullish trend resumed again in October and it finally made a new high above $4,400.
Since then, the bullish trend has held a constant pace and ETH/USD has been making new highs every week. The last high came just below $5,000 as Bitcoin headed for $70,000, so buyers here are in total control. At the bottom, the 20 SMA (gray) is acting as support, holding during pullbacks lower. Yesterday’s retreat ended right at the 20 SMA once again so this moving average is defining the trend for Ethereum and looks like a good place to buy.
Cardano Daily Chart Analysis – ADA Fell Within the Range Again

Cardano returned below the 50 daily SMA
Cardano is one of the few cryptos which weren’t showing any buying momentum during October while most of the other cryptocurrencies were quite bullish. Cardano was trending down in fact, with the 20 SMA (gray) and the 50 SMA (yellow) acting as resistance on the daily chart and stopping all attempts to turn ADA/USD bullish.
Although, the breakout finally came this week, but now it looks more like a fake-out, since the price has fallen in between the moving averages, with the 200 SMA acting as support at the bottom. After the breakout higher on Tuesday after Input Output which is a company associated with Cardano, released a final list of all the projects on the Github repository Cardano ecosystem. Cardano also reveals its plans to digitally connect Zanzibar. But, that didn’t help Cardano turn bearish yesterday, which ended up being one of the biggest losers at the end of the day. At least, the 200 SMA is holding as support.
Solana Daily Chart Analysis – SOL Ready for the Next Bullish Leg

The previous high turned into support for Solana
Solana has been one of the most bullish cryptocurrencies in the entire market. It surged from around $22 in July to $215 where it formed a resistance zone. The price retreated lower in September, but with that many projects coming to Solana ecosystem, nothing can keep this crypto down.
The retreat ended and moving averages turned into support for SOL/USD. The 50 SMA (yellow) provided support in October, while In November the 20 SM has taken up that job, which means that the upside momentum has picked up pace further this month. This week we saw a retreat in Solana as part of profit-taking, but September’s high at $215-220 turned into support and the price is reversing higher now. So, it seems like we might have lost the opportunity to buy, but we might do so if the pride retreats down to that support zone again.
- Check out our free forex signals
- Follow the top economic events on FX Leaders economic calendar
- Trade better, discover more Forex Trading Strategies
- Open a FREE Trading Account
- Read our latest reviews on: Avatrade, Exness, HFM and XM
Related Articles


Sidebar rates
Related Posts
