Bearish Break in Cardano (ADA) and Fantom Crypto (FTM), Bullish Move in Kadena Coin (KDA)


The Last Support at the 200 SMA Low for Cardano
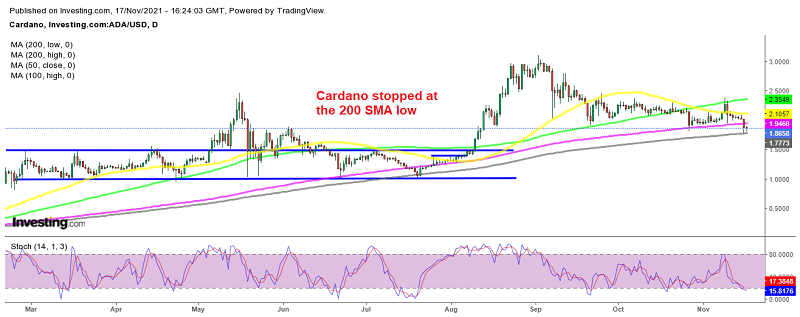
Cardano has been one of the most bearish cryptocurrencies since September, after the bullish momentum ended. The crypto market turned bullish in October, but the Cardano coin (ADA) kept dropping lower, with moving averages (50 SMA yellow) acting as resistance at the top while the 100 SMA (green) was acting as support at the bottom.
The 100 SMA was broken in late October, during the retreat in the crypto market, but the 200 SMA (purple) turned into support. We saw a decent bounce off that moving average early last week, as the crypto market jumped higher, but ADA/USD couldn’t hold above the 100 SMA, which turned into resistance. Then the price reversed, and yesterday we saw a break of the 200 SMA (gray), which took over as support and stopped the decline. So, Cardano remains quite bearish after the failed bullish move last week.
Cardano Coin ADA Live Chart
Fantom Breaks Below the 50 Daily SMA
Fantom has been one of the most bullish cryptocurrencies during the last few months, increasing from around $0.15 to almost $3.50. The 50 SMA (yellow) has been doing a good job as support, but the most important support levels have been the previous highs, so Fantom crypto has been going up in waves.

Let’s see if the support below $2 holds for Fantom
Since September, we haven’t seen a decline below the previous highs, until yesterday. The October high zone at around $2.50, which was acting as support this month, was broken yesterday, as did the 50 SMA. This was an important bearish break for FTM/USD. Although this is a good opportunity to buy Fantom, I would prefer to buy at the next support, just below $2.
Kadena Bounces Off the 20 Daily SMA
Kadena coin was missing out on the crypto rally during August. It was trading at around $2 until October, when it started climbing and increased by 400% to $8. But the biggest surge came in November, with the price rocketing to $26, before retreating to the 50% Fibonacci level at around $13. It then surged back up to $28.50.

The 20 SMA (gray) held as support for the Kadena coin KDA
In the last few days, we have seen a pullback lower, but it ended at the 20 SMA (on the daily chart) which has turned into support. Today, we are seeing a bounce off that moving average, and KDA/USD is resuming the bullish trend again now. This could be a good buying opportunity for those who missed the first surge in this cryptocurrency.