Ethereum (ETH) Attempts to Recover, but $4,340 Resistance is Key
The ETH/USD pair closed at $4,290.00 after reaching a high of $4298.72 and a low of $4070.81
Written by:
Arslan Butt
•
Thursday, November 18, 2021
•
2 min read
•
Last updated: Thursday, November 18, 2021
The
ETH/USD pair closed at $4,290.00, after reaching a high of $4298.72, and a low of $4070.81. After falling to its lowest level since October 28,
ETH/USD snapped a 5-day bearish streak and surged on Wednesday.
Former Goldman Sachs executive Raoul Pal has reaffirmed that he was bullish on Ethereum, the second-largest cryptocurrency by market capitalization, going into the end of this year. He also predicted that the
ETH prices would rise by at least 100% by the end of 2021.
Can Ethereum achieve a 100% to 300% rally?
Pal said he did not expect his prediction to be perfect, but he believed that a 100% to 300% rally was highly probable into year-end. He said that it is certain that ETH will rally as it enters 2022. He also compared the recent price pattern in ETH with that of BTC in 2017, stating that there is a correlation between the BTC prices in 2017 and the ETH prices since June this year. On Wednesday, this optimistic bullish prediction by the former Goldman Sachs executive added further upward momentum to the ETH/USD.
Ethereum, which is the second biggest cryptocurrency by market cap, has been down for many days, as the cost of using the Ethereum network has reached its second-highest level ever. Analysts believe that the hype over the ENS airdrop might be driving the cost higher. The average transaction fee on Ethereum rose to $63 on November 9, which was the second-highest level in the history of the network.
Ethereum Foundation transferred about $9.5 billion
Recently, the Ethereum Foundation transferred about $9.5 billion worth of ETH tokens to the cryptocurrency exchange, Kraken. The proceeds from the sale are expected to be used to compensate the developers. Traders believe that this sale has also added to the recent sell-off in ETH.
The rising prices of ETH/USD on Wednesday could also be attributed to the declining prices of the US dollar on the day. On Wednesday, the DXY was down, after climbing to the 96.24 level, and it weighed on the greenback, ultimately putting more upward pressure on the ETH/USD, due to their negative correlation. The macroeconomic data from the US also kept the local currency under pressure, as the data released on Wednesday was contrary to expectations.
Ethereum (ETH/USD) Technical Analysis
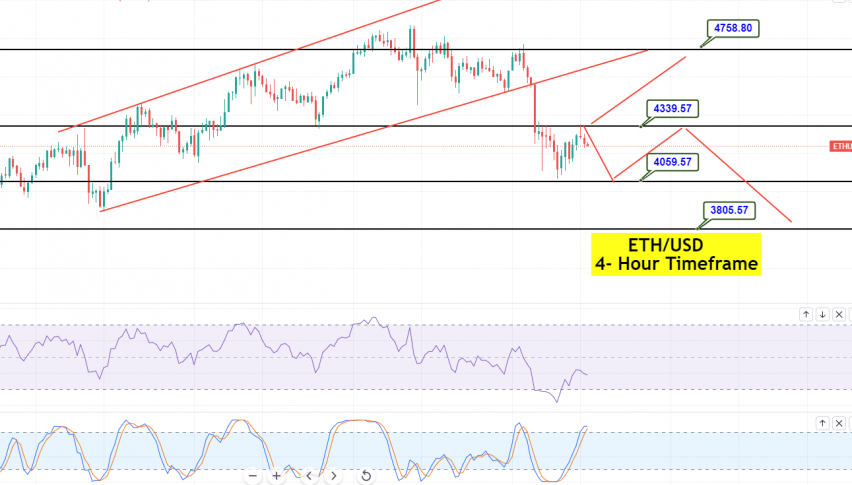
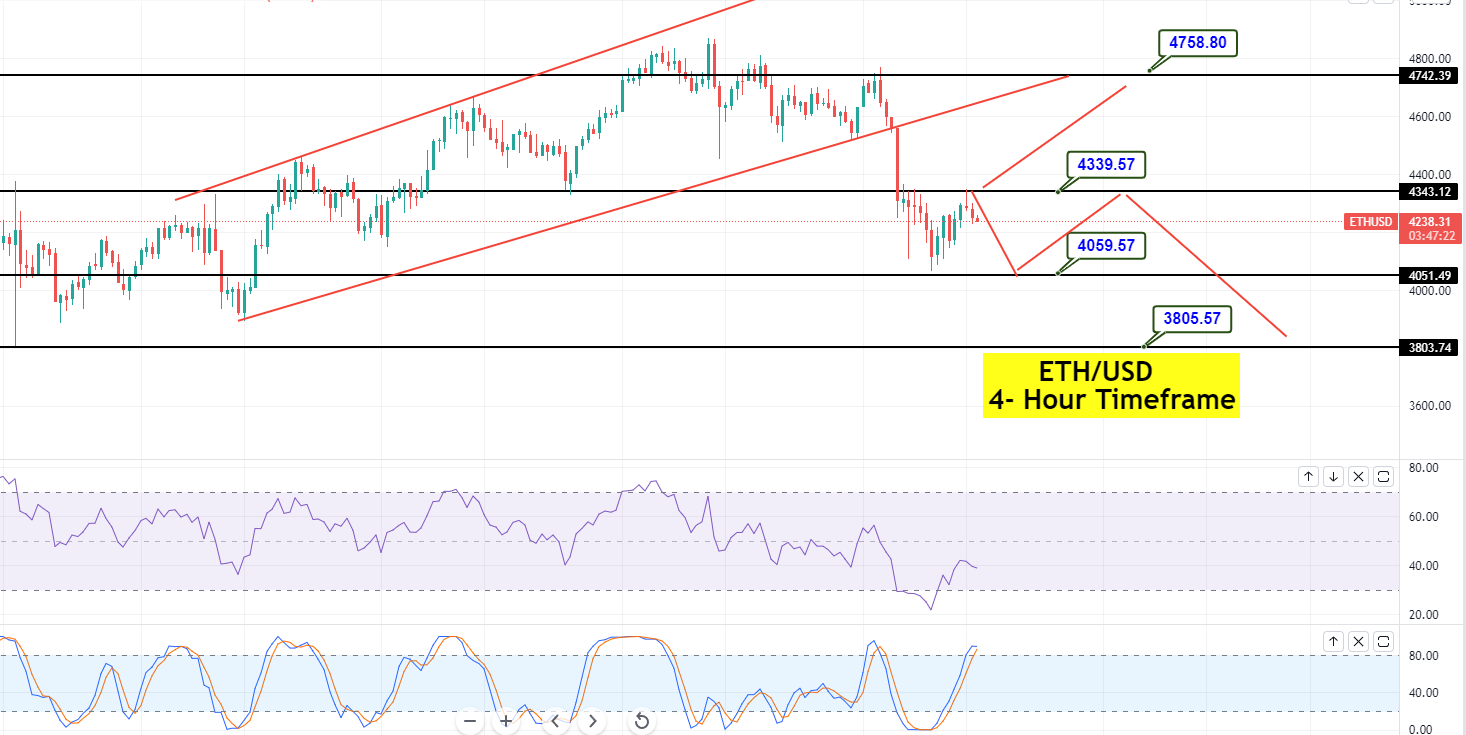
On the technical front, the ETH/USD is trading at 4,250, and facing immediate resistance at 4,339. The closing of candles below the 4,339 level suggests the odds of a continued bearish trend in Ethereum. The coin could find support at the 4,059 level, and a violation of this candle could extend a selling trend until the 3,805 level.

Daily Technical Levels
Support Resistance
4141.62 4369.53
3992.26 4448.08
3913.71 4597.44
Pivot Point: 4220.17Furthermore, on the lower side, a break below the 4,059 level could extend a selling trend until 3,805. Since the leading indicators, such as the
RSI and the Stochastic, are holding in a sell zone, we should consider a sell trade.
On Thursday, the trader’s focus will remain on the 4,339 level, as today, we could see selling below this level, and buying above it. Good luck!
Arslan Butt
Lead Markets Analyst – Multi-Asset (FX, Commodities, Crypto)
Arslan Butt serves as the Lead Commodities and Indices Analyst, bringing a wealth of expertise to the field. With an MBA in Behavioral Finance and active progress towards a Ph.D., Arslan possesses a deep understanding of market dynamics.
His professional journey includes a significant role as a senior analyst at a leading brokerage firm, complementing his extensive experience as a market analyst and day trader. Adept in educating others, Arslan has a commendable track record as an instructor and public speaker.
His incisive analyses, particularly within the realms of cryptocurrency and forex markets, are showcased across esteemed financial publications such as ForexCrunch, InsideBitcoins, and EconomyWatch, solidifying his reputation in the financial community.
Related Articles