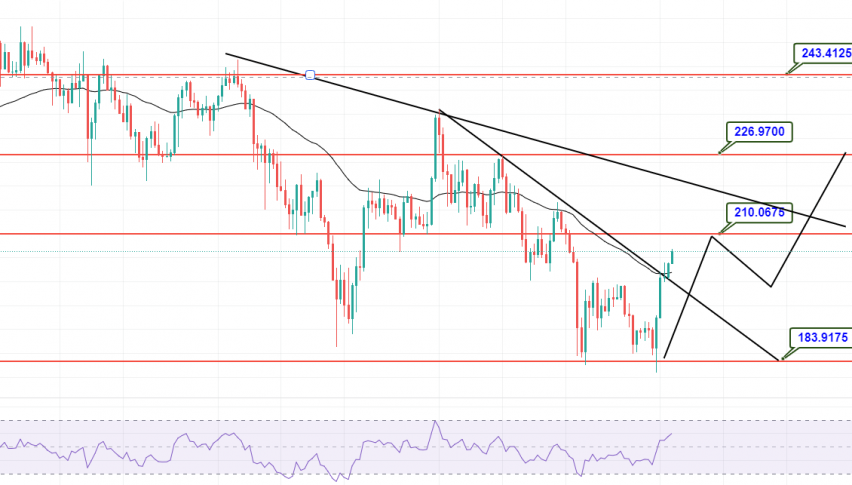
Solana Spikes Over $200, Can SOL Slice Through A Key Hurdle?
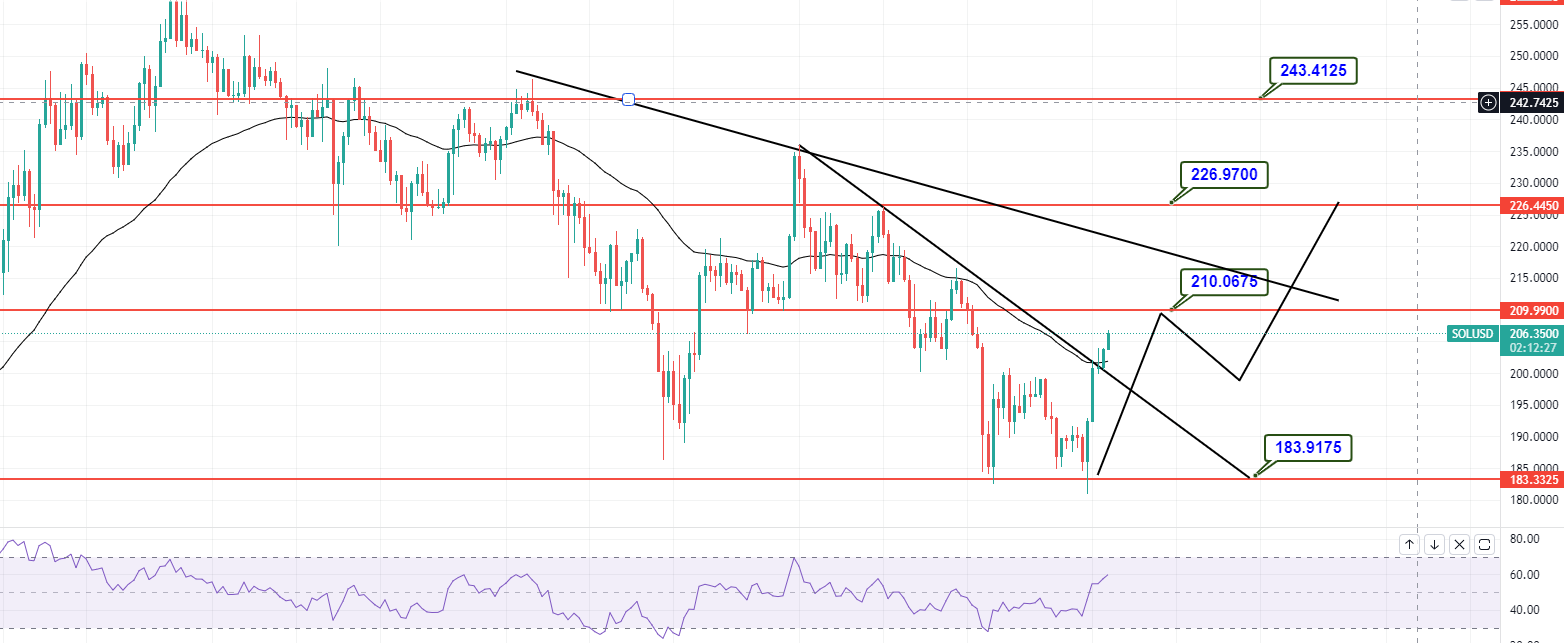
Solana closed at $200.854 after hitting a high of $201.979 and a low of $181.285. The SOL/USD
•
Last updated: Monday, November 29, 2021
SOL/USD Live Rate
SOL/USD
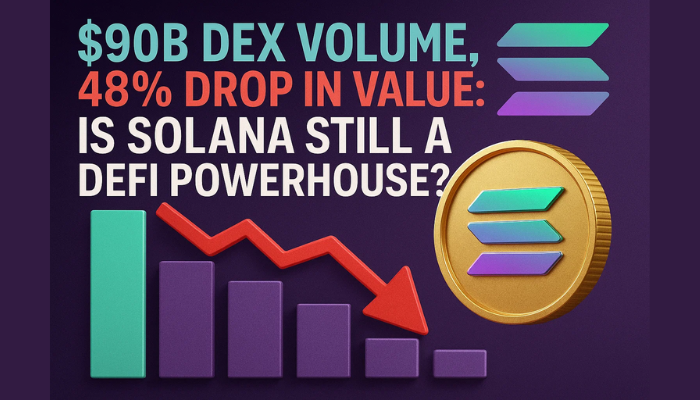
Blockchains using proof-of-work consensus are facing much criticism because of their energy intensity. However, Solana’s proof-of-history consensus has pushed the gains of SOL much higher. Solana’s latest Energy Use Report for November 2021 stated that one transaction on Solana’s blockchain consumed 1836 joules of energy.
Solan Technical Outlook – SOL to Repaint $210
Daily Technical Levels
- Check out our free forex signals
- Follow the top economic events on FX Leaders economic calendar
- Trade better, discover more Forex Trading Strategies
- Open a FREE Trading Account
ABOUT THE AUTHOR
See More
Arslan Butt
Lead Markets Analyst – Multi-Asset (FX, Commodities, Crypto)
Arslan Butt serves as the Lead Commodities and Indices Analyst, bringing a wealth of expertise to the field. With an MBA in Behavioral Finance and active progress towards a Ph.D., Arslan possesses a deep understanding of market dynamics.
His professional journey includes a significant role as a senior analyst at a leading brokerage firm, complementing his extensive experience as a market analyst and day trader. Adept in educating others, Arslan has a commendable track record as an instructor and public speaker.
His incisive analyses, particularly within the realms of cryptocurrency and forex markets, are showcased across esteemed financial publications such as ForexCrunch, InsideBitcoins, and EconomyWatch, solidifying his reputation in the financial community.