Polkadot (DOT/USD) Flashes Bullish Signs. Is the Bearish Market Over?

Polkadot (DOT/USD) moved in a bearish momentum of lower lows and lower highs, from $53 on November 8, to violate the $40 minor support level to $37. The bears took control and pushed DOT/USD lower, to $32, on November 28, in an industry-wide crypto rout that was attributed to reports of a new Covid-19 variant. However, DOT/USD seems to have reversed the trend and is building bullish momentum.
At the time of writing, Polkadot was trading at $37.90, after gaining 5.83% in the past 24 hours, but it was still down 4.14% in the past week. Overall, the crypto industry is recovering, and most altcoins are turning in gains. Ethereum went up by 7.27% in the past 24 hours, and Polkadot could ride the bullish sentiment to go higher.
– A Daily Chart Technical Outlook
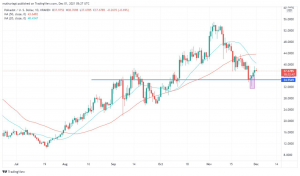
Looking at the DOT/USD daily chart, the $34 level is a strong support zone that has been tested several times. Our confirmation that DOT/USD could be preparing to surge is a bullish pin bar touching the support level on the daily chart. Already, the bullish signal is pushing DOT/USD higher, in an upside that is likely to end the token’s bearish market. The pair, however, is trading below the 50 moving average (red) and the 20 moving average (blue). The two moving averages may act as a temporary resistance in the short term, and we expect to see a consolidation before a continuation of the bullish trend. Further confirmations of the bullish momentum can be observed on the 4-hour chart below:
– 4-Hour Technical Outlook
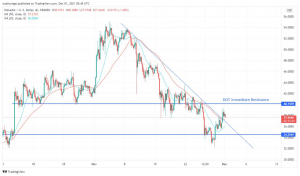
DOT/USD Breaks Above the Descending Trendline
Looking at the four-hour chart above, DOT/USD has violated the descending trendline, further confirming a bullish reversal. The token is now approaching the $40 resistance level. We expect to see a consolidation pattern at this level in the short term, before the bullish trend resumes. On the 4-hour chart, the 20-moving average (blue) and the 50-moving average (red) join the support, suggesting that bullish momentum is imminent.
DOT/USD – A Trade Idea
We remain bullish on DOT/USD in the short term, as long as the $34.5 support continues to hold. The technical analysis is in favor of the bulls, with the improving crypto sentiment supporting higher prices. I recommend a buy trade on DOT/USD at the current level or after a short retracement towards the $34.5 support. If I pick a buy trade at the current level, my profit targets would be $44, $49, and possibly $54. Good luck!
- Check out our free forex signals
- Follow the top economic events on FX Leaders economic calendar
- Trade better, discover more Forex Trading Strategies
- Open a FREE Trading Account
- Read our latest reviews on: Avatrade, Exness, HFM and XM
Related Articles


Sidebar rates
Related Posts
