Deciding Time for Solana and Ethereum – Turn Bullish or Continue Lower?
Ethereum ETH and Solana SOL remain bearish, but the decline might be ending soon
The decline in cryptocurrencies continues for more than a month, which has been sending cryptos lower, losing considerable value during this time. Ethereum and Solana have been showing strong bullish momentum in recent months and they have been holding better than most cryptocurrencies during this retreat. Although, they are facing some decent support indicators, so let’s see if these indicators will hold and the trend will turn bullish again.
Solana Daily Chart Analysis – Will Solana Fall to $130?
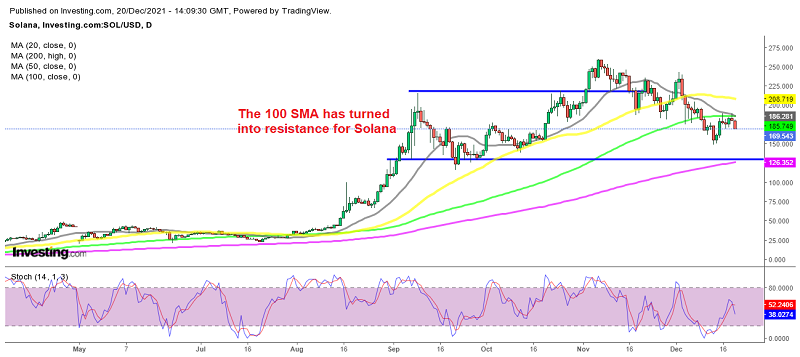
Solana has been incredibly bullish since August, increasing from around $25 to $260, in two waves, first in August and then in October again. During this time, moving averages have been acting as support, particularly the 50 SMA (yellow), although SOL/USD still holds more of the gains, unlike some other cryptos.
The price has slipped below most moving averages and the 20 SMA (gray) has turned into resistance at the top, so there is the possibility that the price falls to the next support at $130. If that’s the case, that that would be a good place to buy Solana.
Solana suffered earlier this month over the news of a possible network outage on Friday. There was network congestion on account of Raydium’s latest AcceleRaytor IDO but it did not take down the network. Although it did cause transaction processing delay, leading to frustration among several users who prefer Solana’s ecosystem for its high throughput against Ethereum’s network congestion issues. Although, it didn’t affect the price, so the decline is due to the bearish sentiment in the crypto market.
Ethereum Daily Chart Analysis – ETH Testing the 100 SMA

The 100 SMA continues to hold as support
Ethereum has also shown buying pressure in recent months, although not as strong as in Solana coin. Ethereum has been steadier as well, taking the market average indicator from Bitcoin. Ethereum failed to break above the $5,000 level, falling below $4,000 during this retreat, but the 100 SMA has been holding as support, despite the sellers keeping testing it.
The long-awaited upgrade to the Ethereum network, which could lower its energy consumption by 99%, has been delayed again. This has been weighing on Ethereum, while on the other hand, the Ethereum-based transaction mixing protocol, Tornado Cash, announced the launch of an upgraded pool called Nova, which will allow for the use of shielded transfers of token deposits without the need to withdraw from the pool itself, as well as depositing and withdrawing arbitrary amounts of ETH. So, ETH/USD has stalled at the 100 daily SMA for about two weeks now,
Ethereum Coin ETH Live Chart
- Check out our free forex signals
- Follow the top economic events on FX Leaders economic calendar
- Trade better, discover more Forex Trading Strategies
- Open a FREE Trading Account
- Read our latest reviews on: Avatrade, Exness, HFM and XM
Related Articles


Sidebar rates
Related Posts
