The Real Bullish Test for Shiba Inu and Solana (SOL) Coins
Shiba INU coin and Solana attempt to turn bullish this week - Can They?
The cryptocurrency market has been in a retreating mode for nearly two months, following a strong bullish period in October and early November. The main cryptos suffered considerable losses during this time, with the Shiba Inu token losing around 65% of its value. But the situation might be changing now, as cryptocurrencies have been gaining in the last few days. But, that’s not clear yet, so the Shiba and Solana coins are facing the bullish test now.
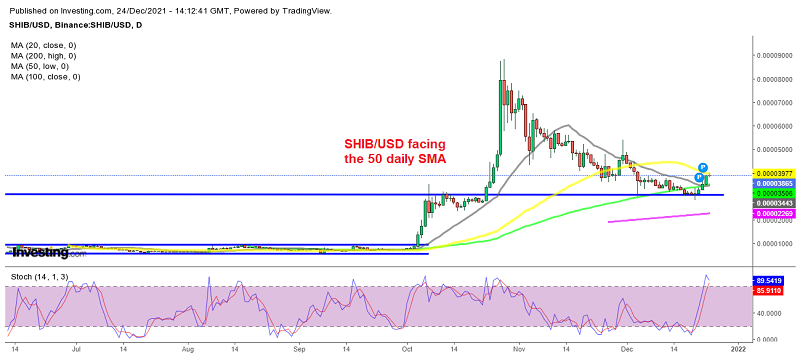
Shiba Inu Daily Chart Analysis – Will Buyers Push Above the 50 Daily SMA?
Earlier this week, I posted an update about Shiba Inu, which was showing buying interest around $0.000030, despite the continuous buying pressure for more than a month. Buyers kept buying Shiba around this level, and even after the pierce below it on Monday, buyers jumped right back, pushing the price above it. Now, it looks like the trend is turning bullish after three daily bullish candlesticks.
Shiba Inu has a strong SHIB Army supporting it, who are all signing an online petition, requesting a massive coin burn soon. If that happens, it will support the price further, since that would bring deflation. The SHIB Army is also requesting crypto exchanges to list Shiba coin, since it is enormously popular.
Shiba Inu Coin Live Chart
The increasing popularity has made different exchanges list Shiba in recent months, with Bit2Me, BitoEX and Unocoin being the latest ones to do so. But, SHIB/USD will have to push above the 50 SMA (yellow) on the daily chart for the trend to turn bullish, otherwise we might see a rejection, and a reversal to the support area. We are following the price action to decide where to buy this coin – at the support around $0.000030, or on a break of the 50 daily SMA.
Solana Weekly Chart Analysis – Bouncing Off the 20 Daily SMA?

Solana finding support at the 20 SMA
Solana held well during this bearish period in the crypto market, as it lost less than half its value. But it broke the support zones around $215 and $185. We were waiting for the price to fall to the next support level at around $130, but it seems like the pullback has ended at the 20 SMA (gray).
This moving average was pierced last week, but the price closed above it, forming a hammer candlestick, which is a bullish reversing signal. This week we are seeing a slow follow-through to the upside, so this appears to be a bullish reversal. This looks like a good opportunity to buy SOL/USD.
- Check out our free forex signals
- Follow the top economic events on FX Leaders economic calendar
- Trade better, discover more Forex Trading Strategies
- Open a FREE Trading Account
- Read our latest reviews on: Avatrade, Exness, HFM and XM
Related Articles


Sidebar rates
Related Posts
