Are Terra (LUNA) and Fantom (FTM) Cryptos About to Resume the Uptrend?
Terra LUNA and Fantom FTM cryptos are finding support on the daily chart
Towards the end of December, it seemed like the decline in the crypto market was coming to an end, after most crypto coins were making a bullish reversal. But, the bearish momentum returned with the new year, and digital currencies continued lower. Yesterday we saw a jump in Terra LUNA and Fantom, which was a positive signal, but today the decline has resumed, and the gains have been wiped out, so the bearish momentum continues. But, the decline in these two cryptos is limited, so let’s look at where they could reverse higher.
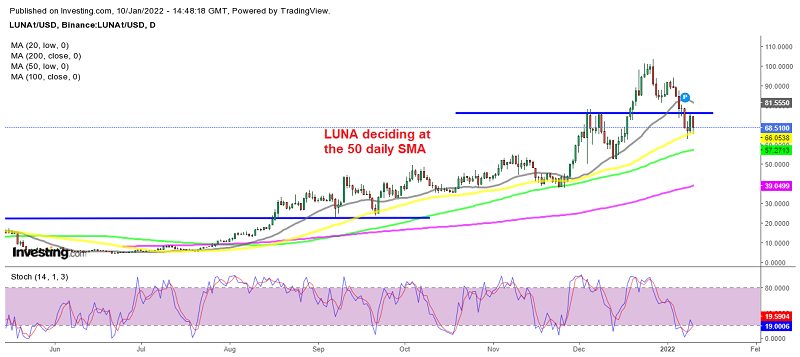
Terra – Daily Chart Analysis; LUNA Facing the 50 SMA as Support
Terra LUNA has been one of the strongest coins recently, increasing from around $5 in August to $103 by the end of December. As can be seen in the chart above, LUNA/USD has been making decent gains in the last two months, even while the market was in a very bearish mode. Moving averages have been doing a great job as support, holding during pullbacks, and pushing the price higher.
But, in the last two weeks, the decline has accelerated in the crypto market, and LUNA coin has been suffering some considerable drawdowns. Although now sellers are facing the 50 daily SMA (yellow), which has been acting as support in the last few days. This network is receiving increasing interest from the public, with the number of applications growing as the DeFi world expands, so losses will be limited. In fact, the 50 SMA might be a good place to buy, since it is oversold on this timeframe chart. Although if it doesn’t hold, then we will watch the price action at the 100 daily SMA (green) and we might buy there.
Fantom Daily Chart Analysis – FTM Facing the 100 SMA as Support
Fantom was also quite bullish until late October, but then it turned bearish before the sentiment reversed in the market and suffered some heavy losses until the middle of December. Although the 200 daily SMA (purple) held as support, and in the second half of December, we saw a decent rally in FTM/USD, with the price climbing from $1.16 to $3.16.

Fantom is oversold on the daily chart
Eventually, the weakness caught up with Fantom coin this year, as the decline accelerated in the broader market. Although, here it has been the 100 SMA (green) that has been acting as support for FTM on the daily chart in the last few days. However, similar to Terra coin, the losses will be limited for Fantom as well, because it has strong fundamentals behind it.
The TVL keeps growing toward $7 billion, as the DeFi in Fantom keeps growing. More than 1 million transactions were processed on the Fantom network last week, so once the sentiment improves in the market, Fantom will be one of the first coins to turn bullish. Therefore, we are following the price action after losing the first opportunity to buy FTM at the 200 SMA around $1.20.
- Check out our free forex signals
- Follow the top economic events on FX Leaders economic calendar
- Trade better, discover more Forex Trading Strategies
- Open a FREE Trading Account
- Read our latest reviews on: Avatrade, Exness, HFM and XM
Related Articles


Sidebar rates
Related Posts
