Can Solana (SOL) and Kadena (KDA) Crypto Reverse at Support?
Solana SOL and Kadena KAD cryptos are facing support now after the 2-month decline
Solana and Kadena coins made some decent gains in October, although they turned bearish together with the crypto market in early November and have been bearish since then. They have broken some important support levels, but are facing further support now, where the decline might stop and the trend might reverse, but let’s see if these support zones can hold.
Solana Daily Chart Analysis – Can the 200 SMA Hold for SOL?
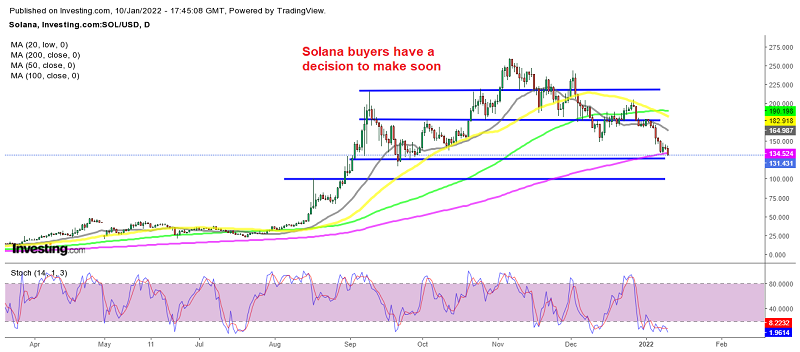
Solana made impressive gains in August until early September when it surged from around $25 to $215. Since then the bullish momentum slowed but the uptrend continued for SOL/USD. Although, it kept making gains until reaching $260 by early November.
Since then, the trend has reversed as the sentiment turned bearish in the market. Some support levels and moving averages have been broken, but now SOL/USD is facing the 200 daily SMA (purple) and below there is the next support at $125.
Solana is a very promising blockchain with hundreds of projects and applications built on it as Solana developers try to bring down gas fees further and make it more scalable, while The DeFi TVL in Solana exceeds $11 billion and is growing. This means that the downside will be limited and we should look where to buy this cryptocurrency. This area seems like a good place, so we are keeping an eye on Solana.
Kadena Daily Chart Analysis – KDA Returning at Support Again

Will the support zone above $8 hold for Kadena coin?
Kadena made most of its gains in October, as it surged from around $2 to $28.50. Although it reversed down following the bearish reversal in the crypto market. KDA/USD formed a support zone above $8, where it bounced from in the second half of December and the price climbed to $18, which seemed like the bullish trend had resumed again.
The support zone has been holding for several days but there has been no bounce
But, the previous support turned into resistance and the price reversed back down after the upside-down pin which is a bearish reversing signal after the climb. The decline in the crypto market has weighed further on Kadena coin and now this cryptocurrency is facing the support zone above $8 again.
The Kadena network is a scalable Layer 1 PoW blockchain that can execute up to 480,000 TPS, due to its use of “braided chains.” The interest for Layer 1 blockchains has returned, which means that Kadena will resume the bullish trend again, so we are following the price action to see if this will be the reversal area. You can follow our live crypto signals page to see when we will buy Kadena coins.
- Check out our free forex signals
- Follow the top economic events on FX Leaders economic calendar
- Trade better, discover more Forex Trading Strategies
- Open a FREE Trading Account
- Read our latest reviews on: Avatrade, Exness, HFM and XM
Related Articles

Sidebar rates
Related Posts
